
Hunting SMB Shares, Again! Charts, Graphs, Passwords & LLM Magic for PowerHuntShares 2.0
Every hacker has a story about abusing SMB shares, but it’s an attack surface that cybersecurity teams still struggle to understand, manage, and defend. For the benefit of both attackers and defenders, I started an open-source GitHub project a few years ago called “PowerHuntShares”. It focuses on distilling data related to shares configured with excessive privileges to better understand their relationships and risk. A lot has happened in the industry since the tool’s creation, so the PowerHuntShares v2 release is focused on making incremental progress by exploring some additional analysis techniques to help cybersecurity teams and penetration testers better identify, understand, attack, and remediate SMB shares in their environments. For those interested in the previous PowerHuntShares release, here is the blog and presentation.
Let the pseudo-TLDR/release notes begin!
TLDR: New Functionality & Insights
- Interesting File Discovery (~ 200)
- Automated Secrets Extraction (50)
- Share & Application Fingerprinting – LLM-Based & Static (80)
- Asset Risk Scoring
- Share Similarity Scoring
- Peer Comparison Benchmark
- Share Creation Timeline Chart
- Remediation & Task Reduction Calculations
- ShareGraph Explorer
TLDR: Basic Functionality
- Updated tables to support sort, filter, and csv export
- Added charts that support csv and image export options using ApexCharts.js
- Basic style updates
This release is packed with new functionality and insights, so let’s dive in!
Running PowerHuntShares
I’ve provided more details on the GitHub page, but PowerHuntShares is a simple PowerShell script that can be downloaded and run using PowerShell 5.1 or greater on Windows systems. Below is a summary of how to get started.
1. Download PowerHuntShares here.
2. Bypass the PowerShell execution policy if needed.
# Bypass execution policy restrictions
Set-ExecutionPolicy -Scope Process Bypass
*Additional Options Here – https://www.netspi.com/blog/technical-blog/network-pentesting/15-ways-to-bypass-the-powershell-execution-policy/
3. Load PowerHuntShares in one of two ways:
a. Option 1: Open PowerShell and import the module.
# Import module from the current directory
Import-Module .\PowerHuntShares.psm1
b. Option 2: Open PowerShell and load it directly from the internet.
# Reduce SSL operating level to support connection to GitHub
[System.Net.ServicePointManager]::ServerCertificateValidationCallback ={$true}
[Net.ServicePointManager]::SecurityProtocol=[Net.SecurityProtocolType]::Tls12

# Download and load PowerHuntShares.psm1 into memory
IEX(New-Object System.Net.WebClient).DownloadString("https://raw.githubusercontent.com/NetSPI/PowerHuntShares/main/PowerHuntShares.psm1")
4. Run PowerHuntShares from the PowerShell console. If you are already a domain user on a computer associated with the target Active Directory domain, you can just run it. If you are starting from a non-domain system typically people run it using the process below.
a. Open cmd.exe and execute PowerShell or PowerShell ISE using the runas command so that network communication authenticates using a provided set of domain credentials.
runas /netonly /user:domain\user PowerShell.exe Set-ExecutionPolicy -Scope Process Bypass Import-Module Invoke-HuntSMBShares.ps1 Invoke-HuntSMBShares -Threads 20 -RunSpaceTimeOut 10 -OutputDirectory c:\folder\ -DomainController 10.1.1.1 -Username domain\user -Password password
Note: I’ve tried to provide time stamps and output during run-time, so you know what it’s doing.
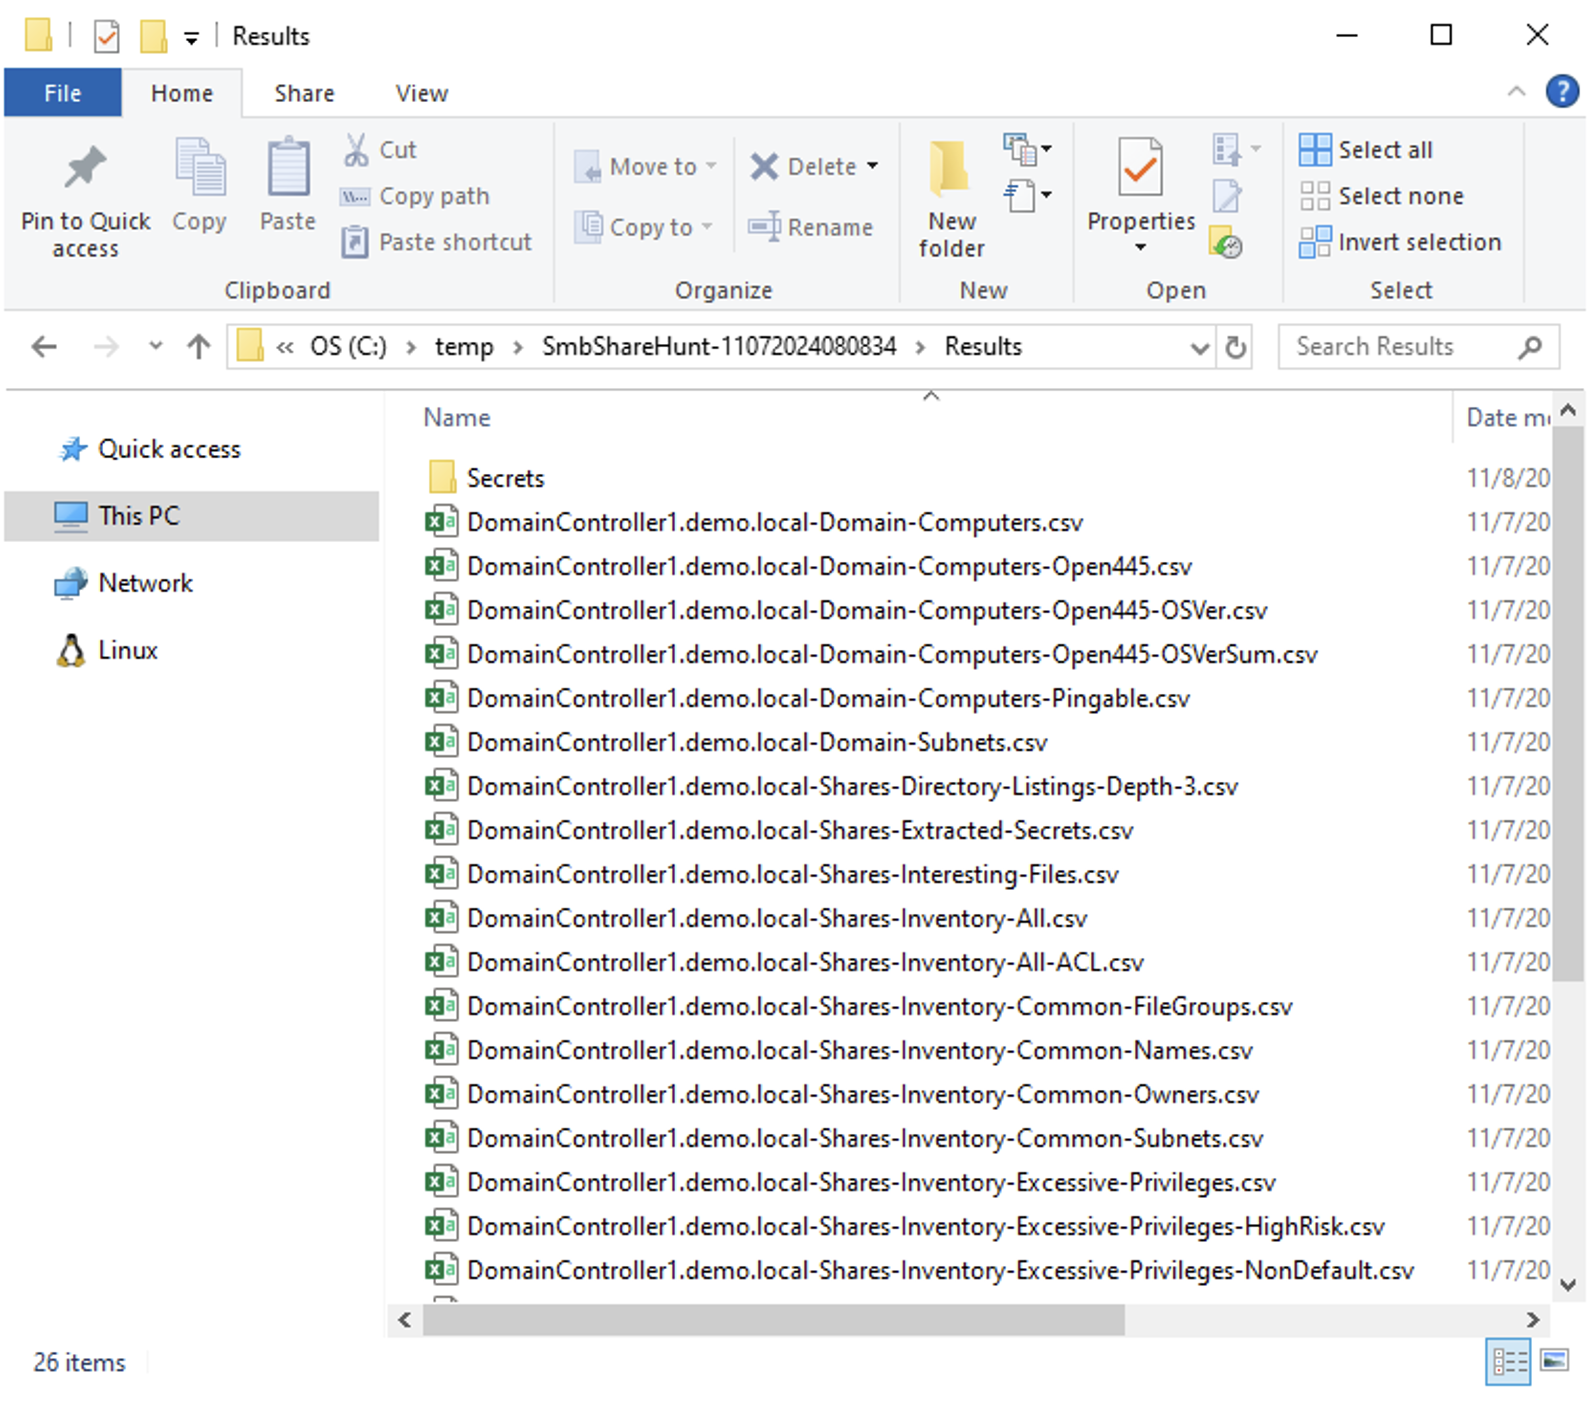
After running, PowerHuntShares will output a new directory that contains an interactive HTML report, and a subdirectory named Results.
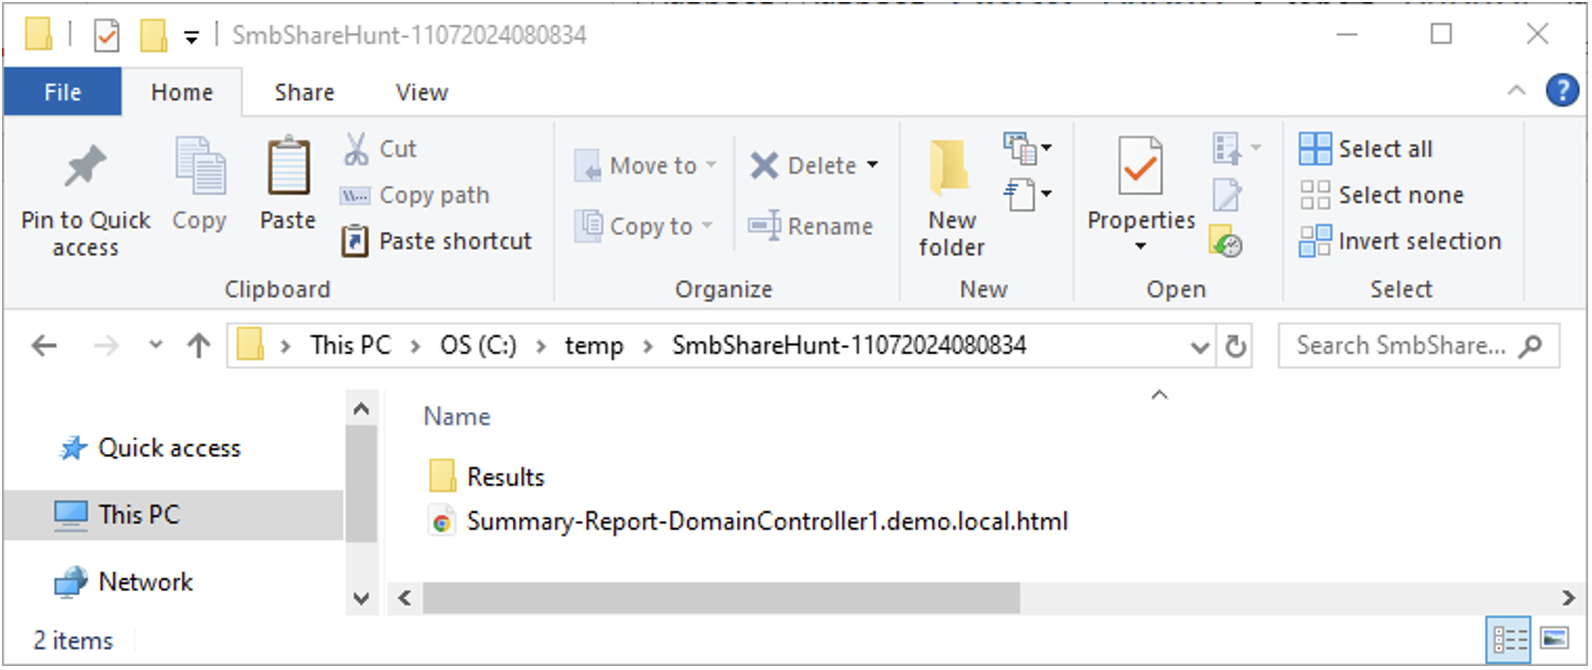
The Results directory houses csv files containing all the computer, share, file, and permission data collected, including things like excessive privileges and stored secret samples.
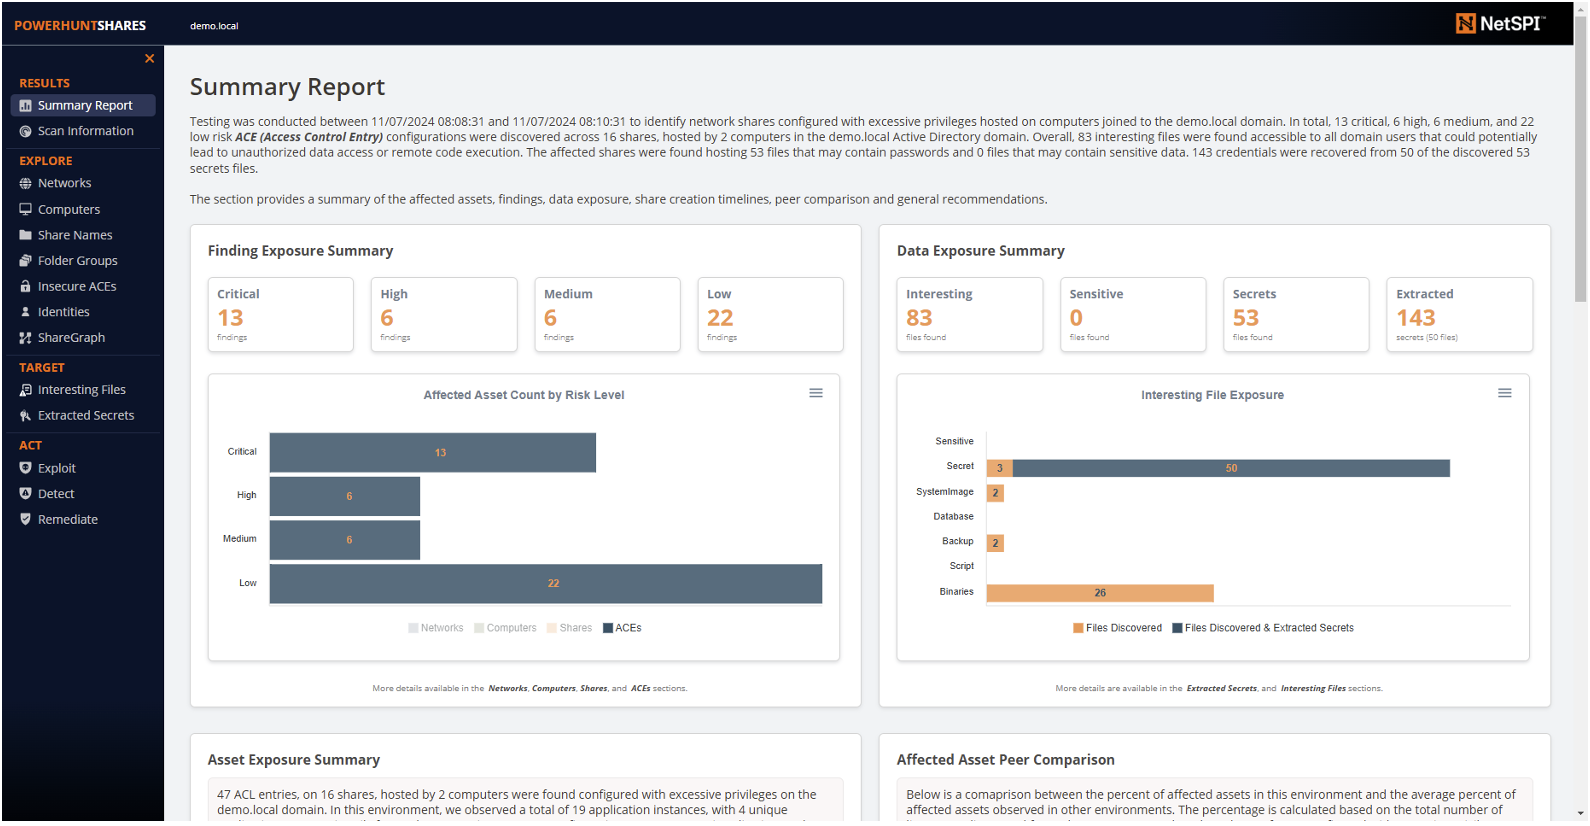
The interactive HTML report attempts to consolidate and summarize the results. You can expect the report to look something like this. It feels like a web app, but it’s really just a bloated HTML file ;).
Alrighty, now they we’ve covered how to run the basic script, let’s dig into some of the v2 features.
Risk Scoring
“Be honest, how bad is it?”
Some environments have thousands of insecure share permissions that need to be fixed, so a little guidance for prioritizing remediation can go a long way. That’s why risk scoring was such an important thing to include in this release. I may cover the (super simple) math in more depth in another blog, but for now just know that the risk model is a simple formula that helps evaluate and rank risk based on the questions below:
- Is the share name known to be remotely exploitable?
- Is the share writable?
- Is the share readable?
- Does the share potentially contain sensitive data?
- Does the share potentially contain stored secrets?
- Has the share been modified in the last year?
- Is it a default share?
- Is the share empty?
Yep, that’s it. Super simple.
When the PowerHuntShares PowerShell script runs, it will automatically evaluate the risk of every excessive permission it finds and save it to a csv file for you. However, I also wanted to include some of those results in the HTML report. While every page in the HTML report has a chart related to risk, the dashboard includes a nifty little chart showing the total number of permissions that fall into each risk bucket. You can also click the buttons for more details.
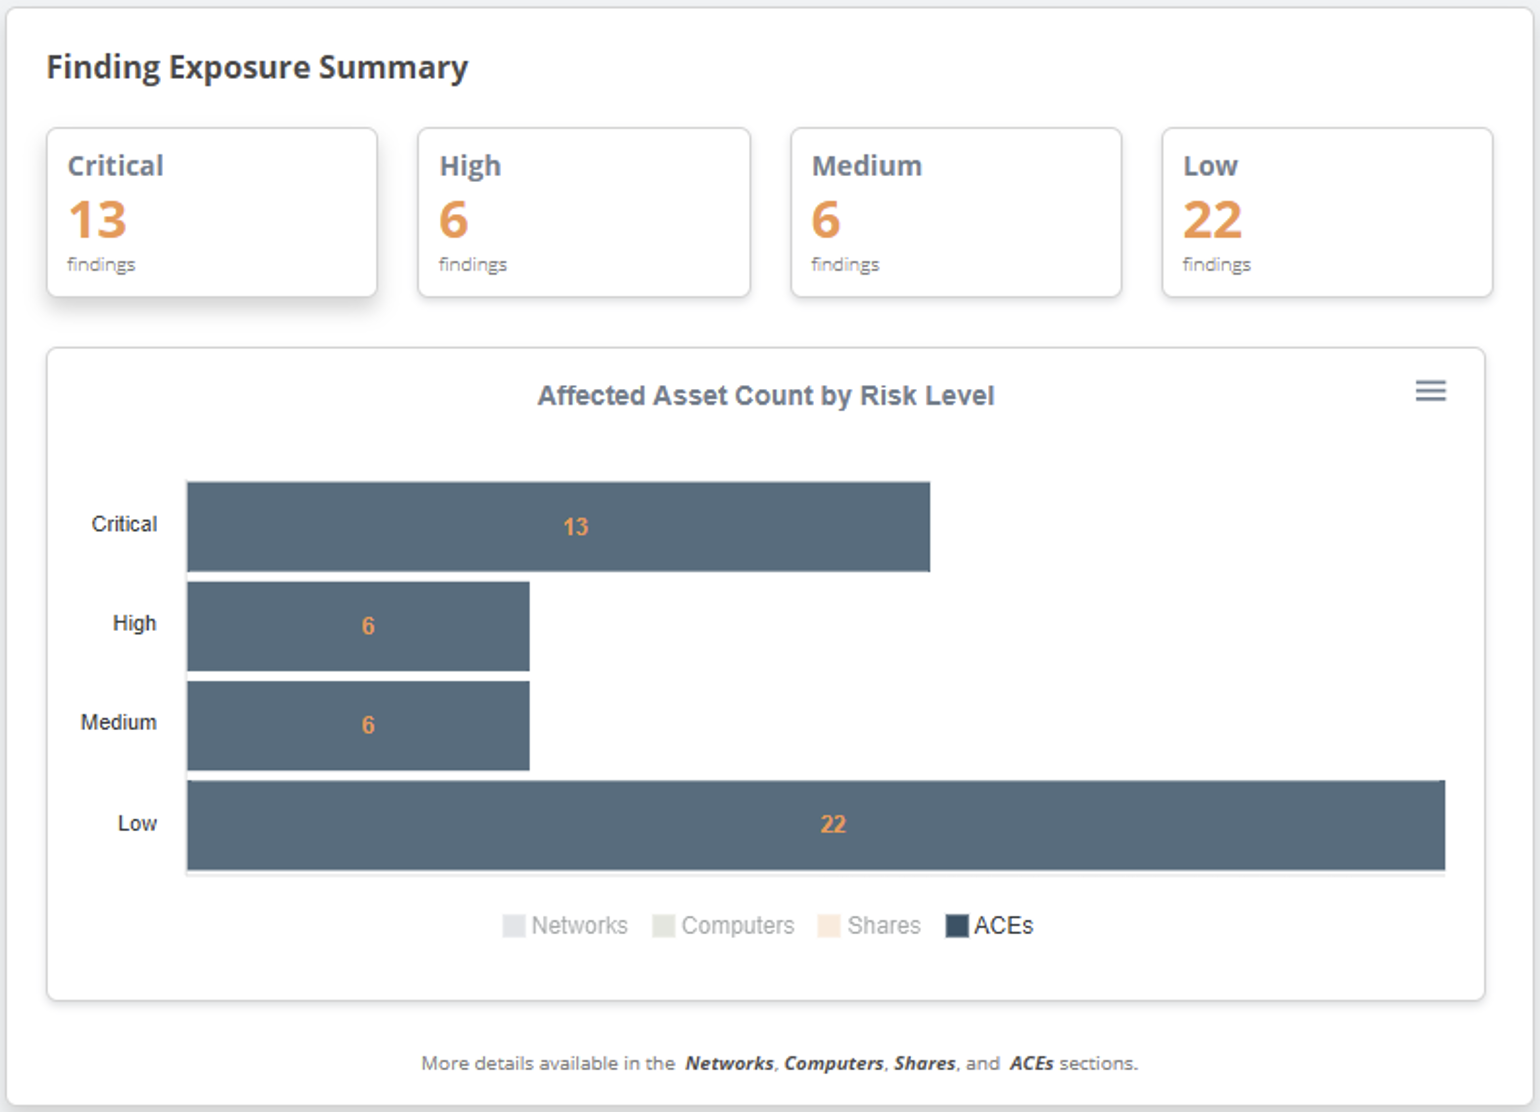
By default, the bar chart only shows ACEs with excessive permissions, but you can click Networks, Computers, and Shares to see the number of affected assets for each risk level, as shown below.
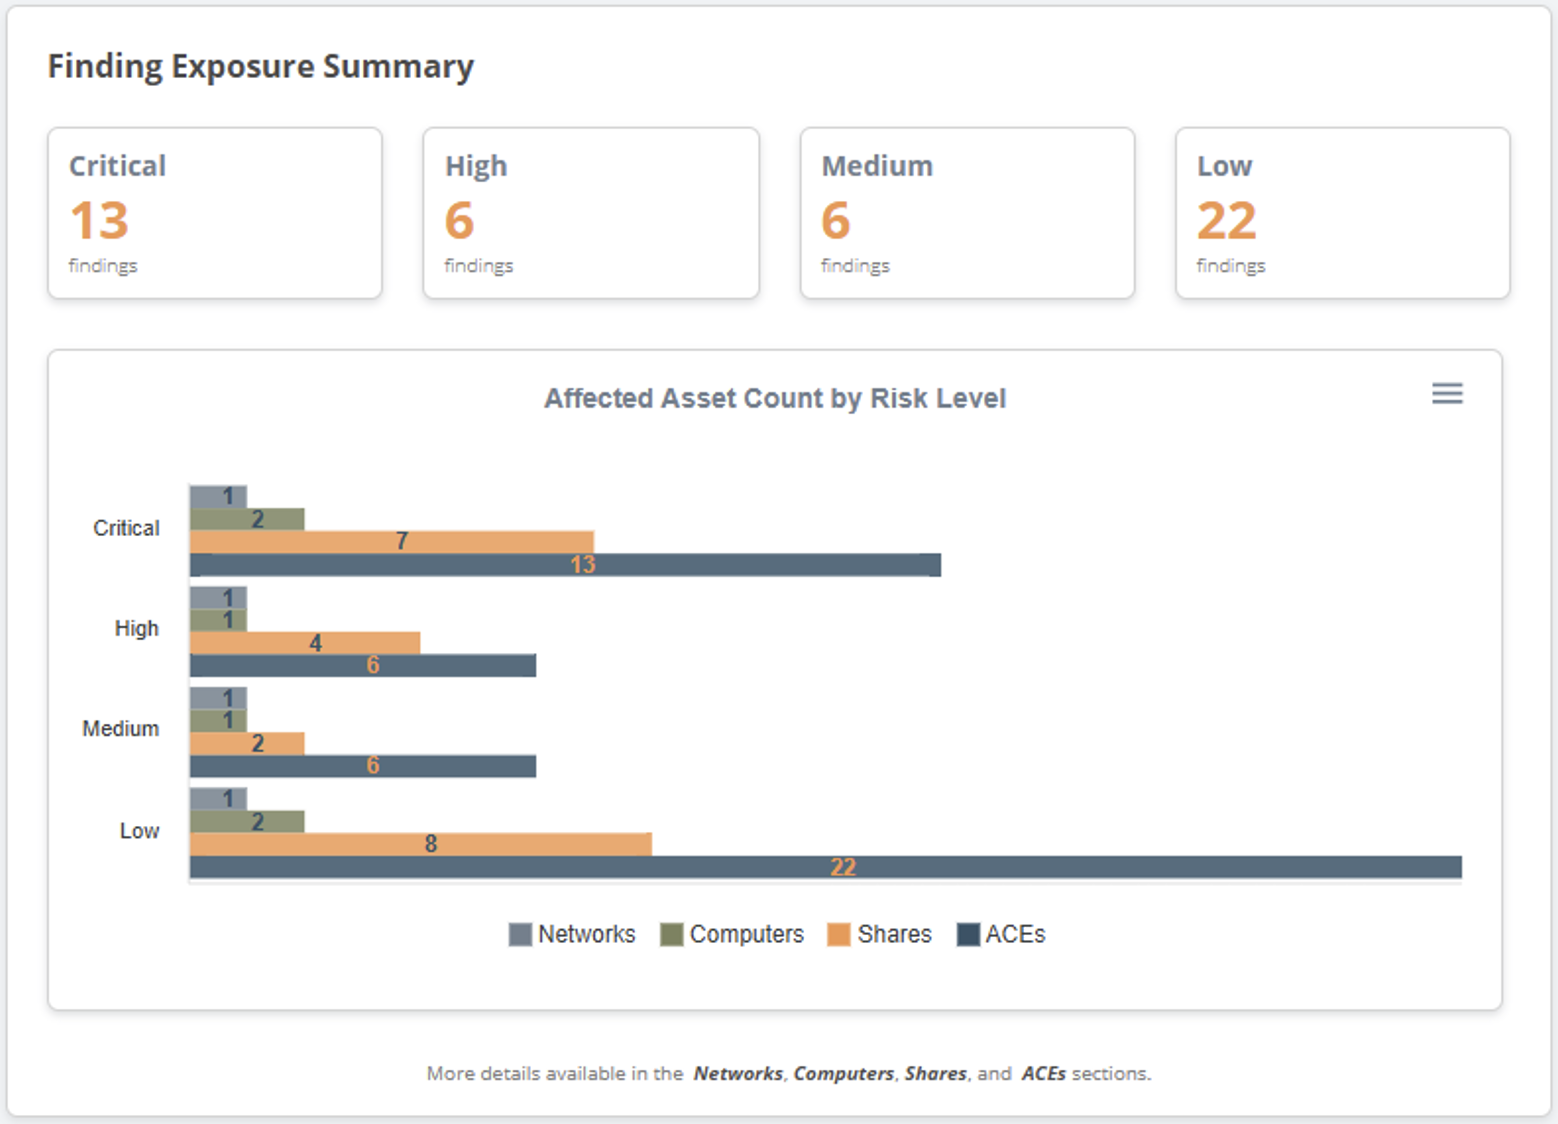
In the example above, you can see that 13 critical risk permissions were found on 7 shares, hosted on 2 computers, on one subnet.
Similarity Scoring
“How similar are shares that have the same name, can I fix them all at once?”
In the first version of PowerHuntShares I attempted to help blue teams reduce the number of remediation tasks by grouping shares by their name. However, the reality is that just because they share a name, doesn’t mean they’re the same. So, this round I wanted to find a more accurate way to measure and rank how similar groups of shares are based on some common criteria. I can cover the (very simple) math in another blog, but for your general knowledge, the similarity score is based on a formula that uses the following items to determine how similar a group of shares is:
- Share Name
- File Name (How many files of the same name exist in 10% or more of the shares in the group)
- Folder Group Coverage (How many unique file listings exist)
- Creation date to share name ratio
- Last modified date to share name ratio
- Owner to share name ratio
- Folder group to share name ratio
- Share descriptions to share name ratio
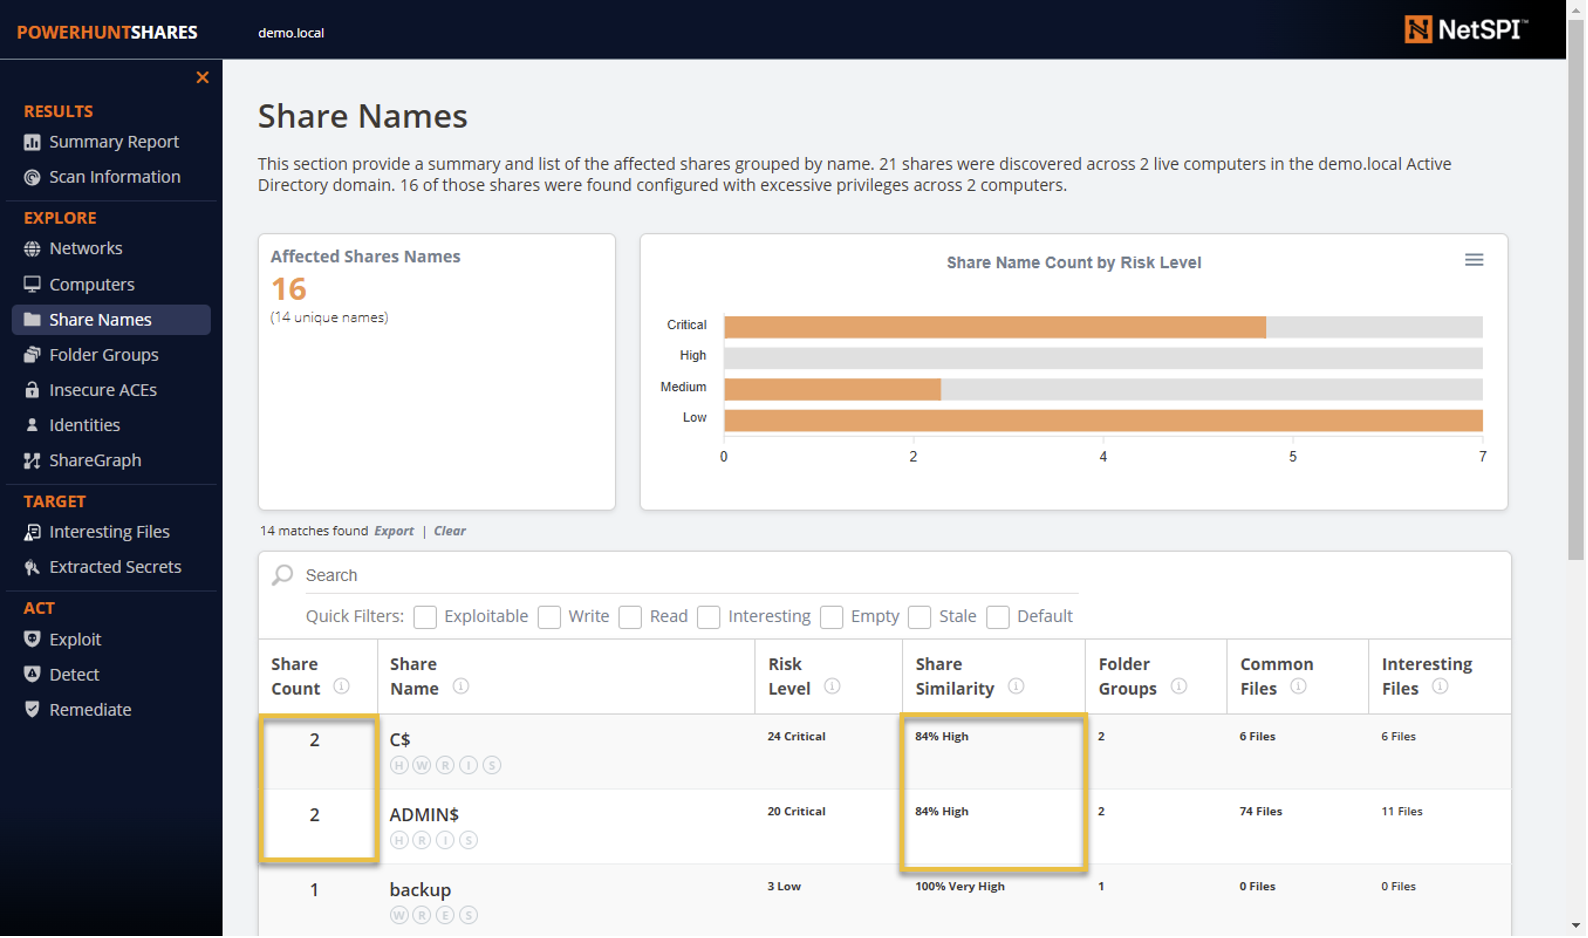
Now, you may be asking yourself, “Aren’t there cooler ways to measure similarity? Why didn’t I use a badass, well-known clustering algorithm for this?”. To that I would say, yes, that would be fun, but I’m using PowerShell to generate all of this and wanted to keep it “simple”. I was able to get the data into a cytoscape.js graph, but I didn’t have time to play with the algorithms for this release, maybe next round. 🙂 For now, you can find the similarity score in the “Share Names” section of the HTML report. As shown below, you can see the number of shares with the same name, their calculated similarity, number of folder groups, files share across share, and more.
Expandable Sections
“Show me more!”
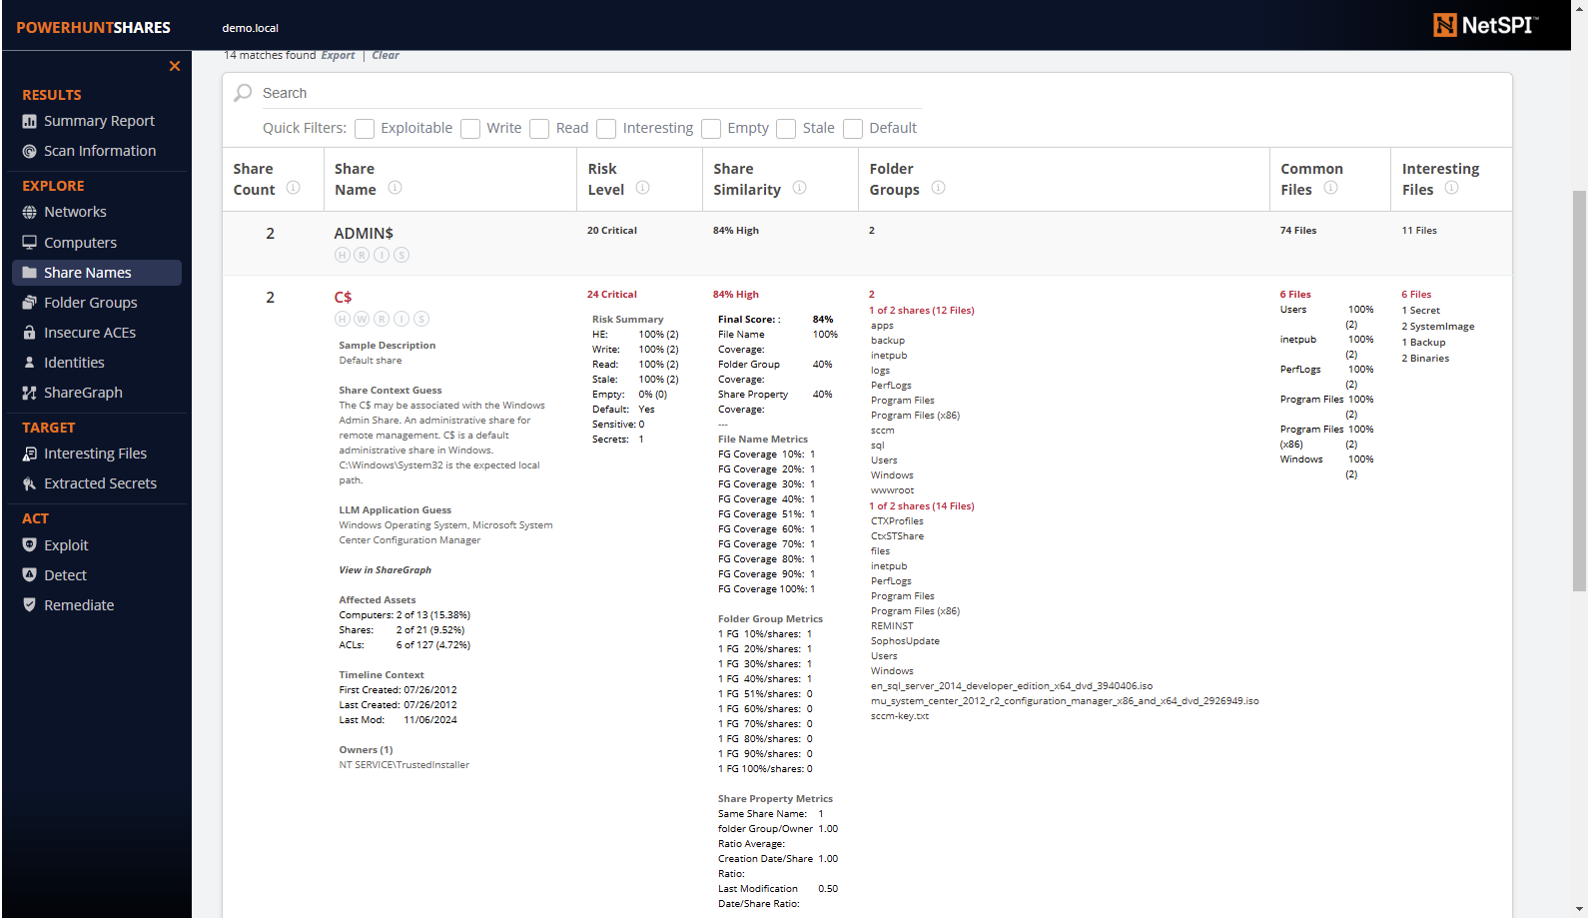
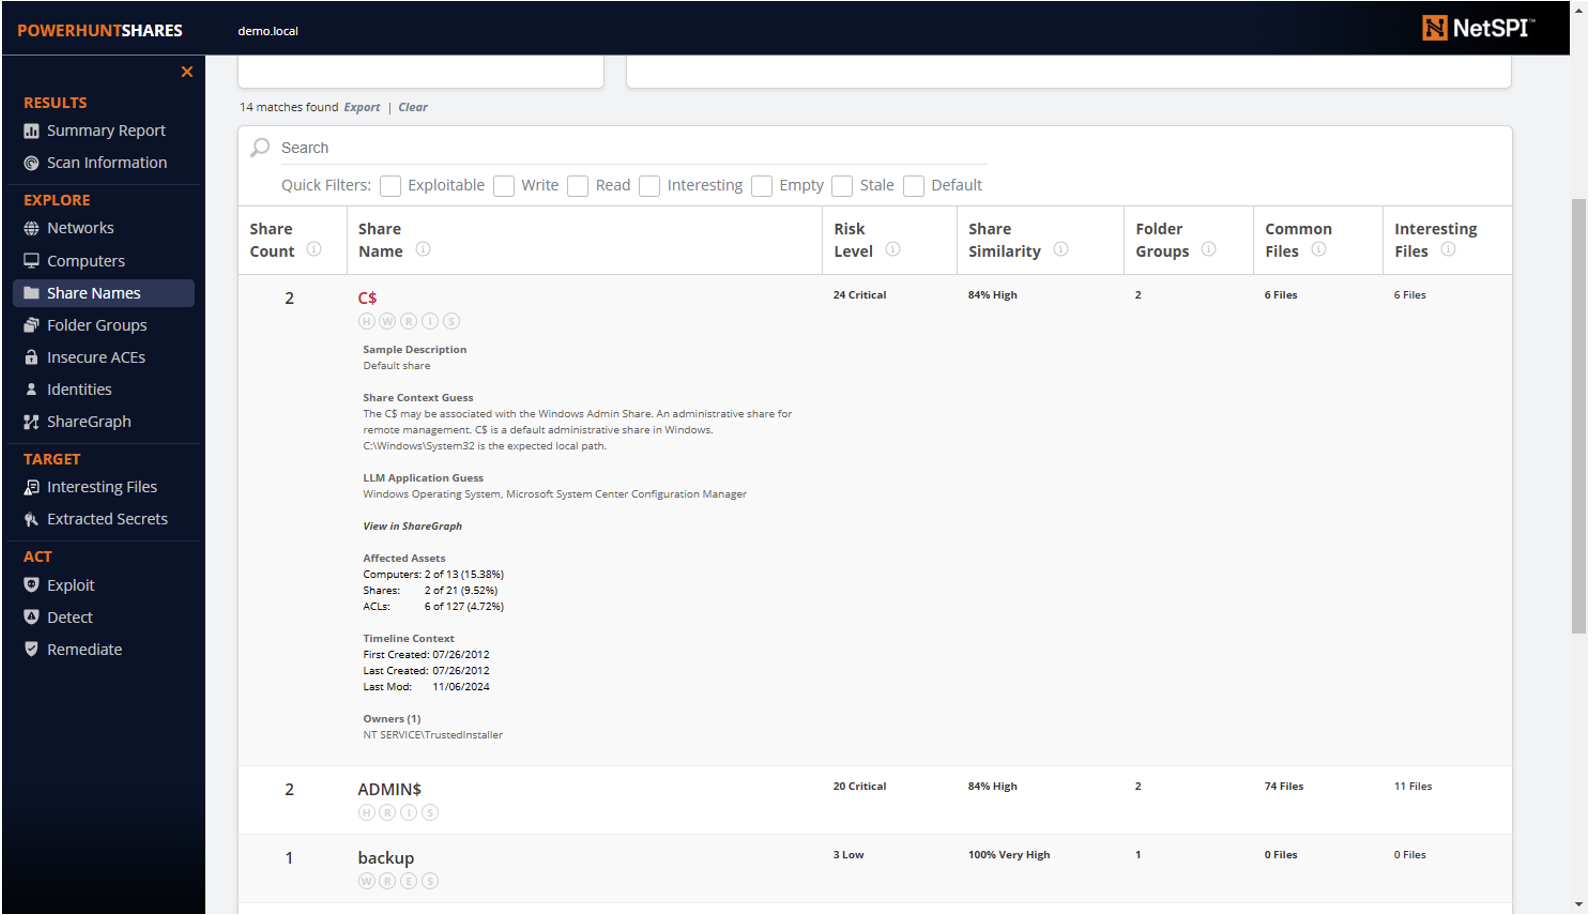
Several people said that it would be nice if they had the ability to drill down into the data found in the HTML report tables. You have been heard. On the “Share Names” page we saw in the last section, you can now drill down into every column of every row, and you can click any of the items below to expand.

Expanding each section reveals a lot more data for those interested in more context. That includes, but is not limited to share application fingerprinting, creation/last modified dates, share owners, and even file listings.
Is it perfect? No. Is it a start in the right direction? Hopefully. 🙂
Peer Comparison Benchmark
“So, I have 1,000 critical risk configurations, really? Good to know, but how do I compare to my peers?”
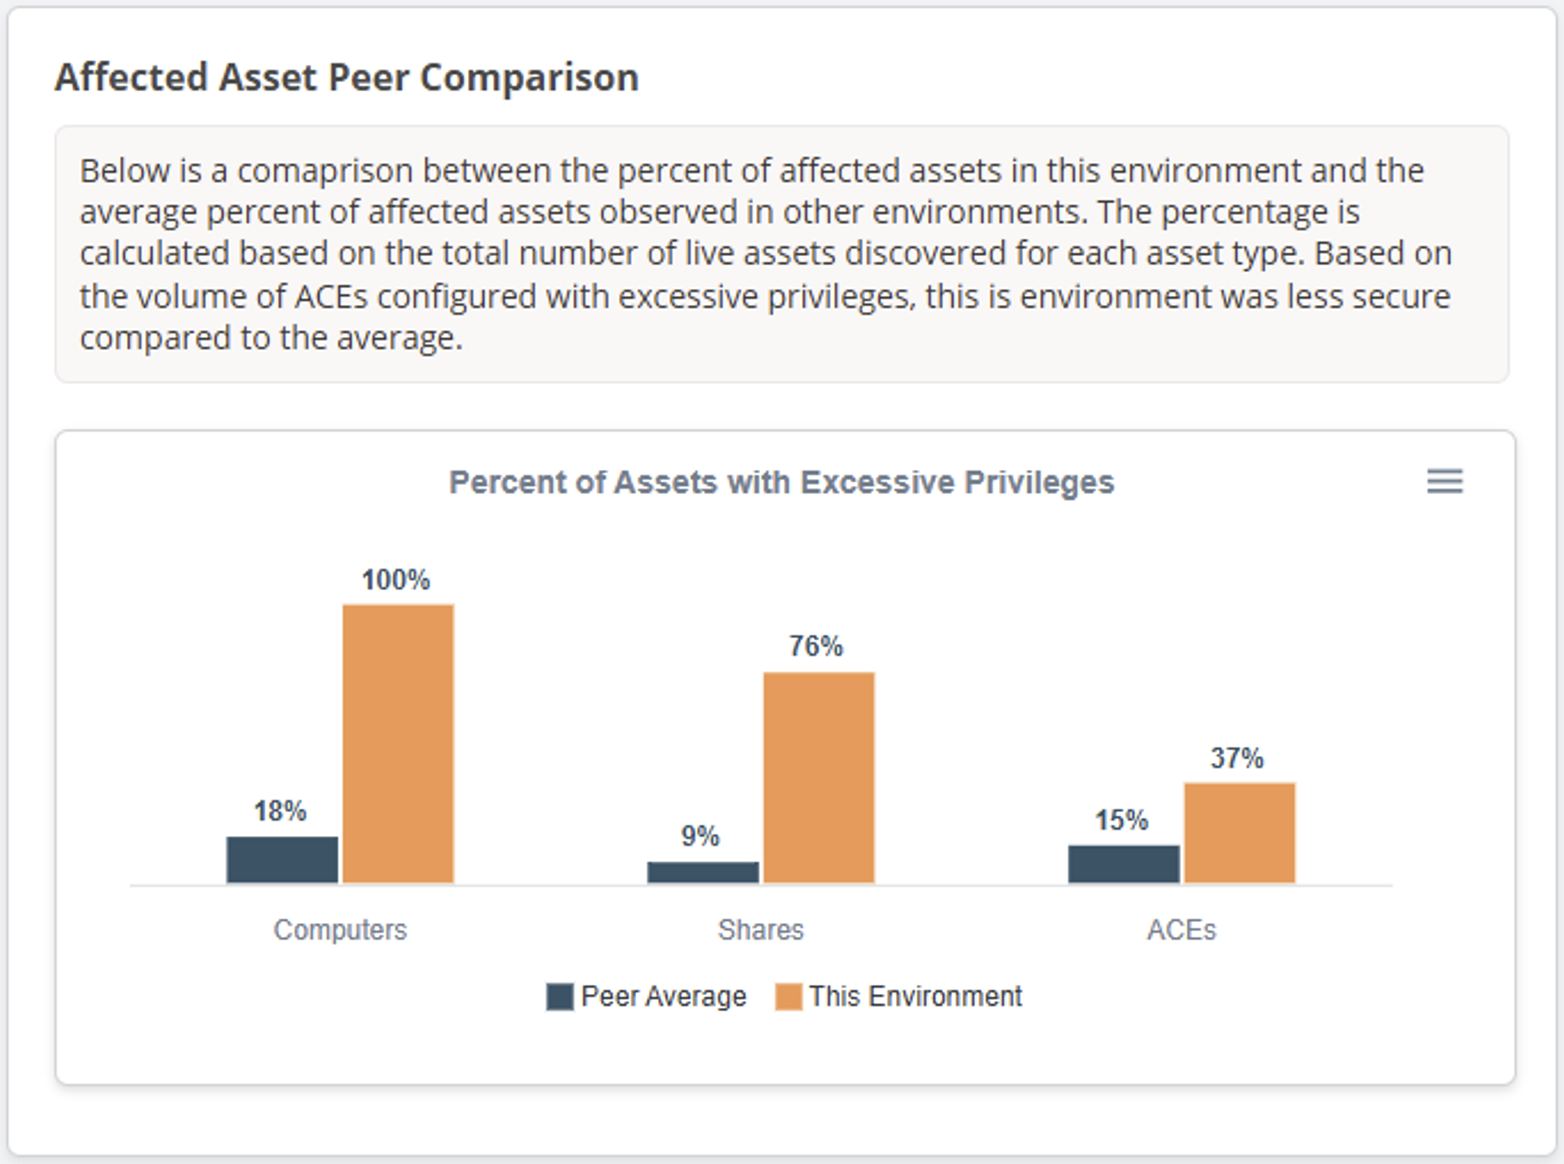
I hear people say things like that a lot. Generally, I think some people want the option to say, “yeah, we’re not great, but neither is anyone else”. Regardless, if I think that is a valid or healthy narrative, I’ve distilled a lot of data to identify rough averages for the percentage of computers, shares, and permissions (ACE) affected by SMB share excessive permissions we’ve observed in the past. The numbers are not perfect, the numbers will suffer from data drift, but my hope is they will also give people a rough idea of how they compare to “normal”. Below is a look at the peer comparison chart on the HTML report dashboard.
Remediation Task Reduction Calculations
“Wait, I can fix 10 things instead of 1,000? Tell me how that works!”
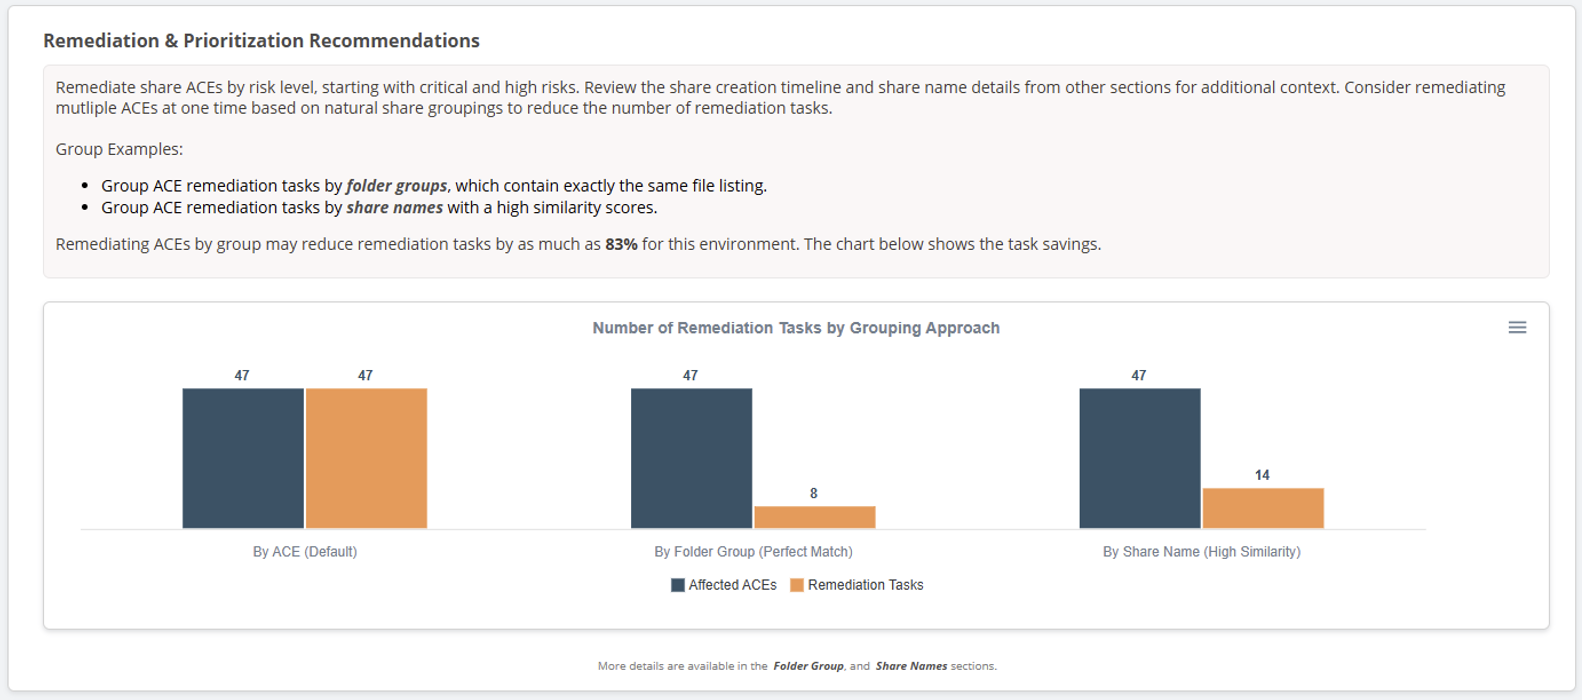
Naturally, grouping shares by folder group, share name, or similarity score and remediating each group at once, can dramatically reduce the time it will take to clean up your environment. In some cases, we’ve seen up to a 90% reduction in remediation tasks. The remediation section of the dashboard now includes a summary and chart showing the benefits of those approaches.
Share Creation Timeline Chart
“When did all this happen, how long have we had this exposure?”
That’s another question I’ve heard from clients. The Share Creation Timeline is my second attempt to illustrate the story of offending share creation and how long high and critical risk configurations have been in the environment. This round I also added a line to show where the average is and attempted to identify abnormal spikes in share creation using standard deviation. I’ve found it helpful for storytelling. However, if you want to play with the time series data on your own, PowerHuntShares automatically saves the creation, last accessed, and last modified dates to the csv output files.
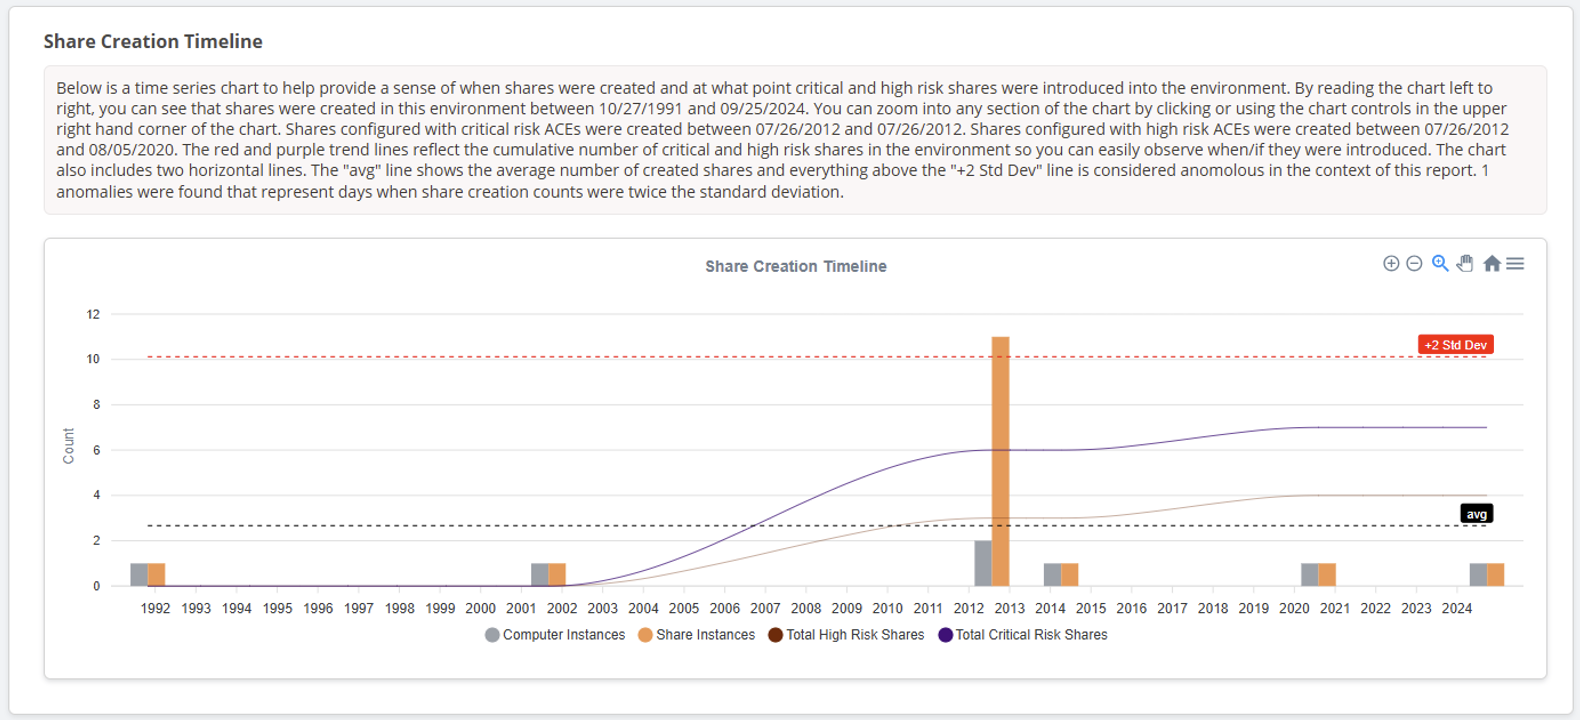
As a quick note, I used apexcharts.js for this timeline chart.
Share Fingerprinting
“I have no memory of this place.”
It is common for clients to have no idea what their shares are used for. In most companies there usually isn’t a person who knows the activities of every business unit. So having ways to generate additional context is useful for blue teams (and pentesters). To help with that, I added a couple of methods for guessing the application context using static lists and optionally, the all mighty Large Language Model (LLM).
Static Share Fingerprinting Library
I did a little research on common applications and the shares they create. Out of that research, I created an initial library of about 80 applications and the associated share names. This fingerprint method will always run automatically. Accuracy is ok, but somewhere around ~70%.
LLM-Based Share Fingerprinting
Who wants to put AI in everything? Me, apparently. Guessing what applications are associated with share names alone can be tricky. I wanted a better way to identify potentially related applications using both the share name and the file listings. It turns out that a little bit of LLM prompt-foo can go a long way here. Accuracy is a little higher with this method coming in around ~80%.
For this first round, I decided to use Azure OpenAI Studio to spin up GPT 4o and GPT 4o mini endpoints. Thanks to Karl Fosaaen and Nick Stang, I’ve become a big fan. It was easy to set up and get rolling in no time. I’m not going to cover setup of the Azure endpoints in this blog, but I will say that once you have it setup, all you’ll need to get started with the new PowerHuntShares functionality is the API key and endpoint.
Below is a sample command, but please remember this has only been tested with the configuration above. No fine tuning was done, and no RAGs were used.
Invoke-HuntSMBShares -OutputDirectory C:\temp\ -ApiKey "[YourApiKey]" -Endpoint "https://yourendpoint.openai.azure.com/openai/deployments/yourendpoint/chat/completions?api-version=1849-08-01-preview"
For those that want to play with share application fingerprinting without PowerHuntShares, I’ve also created a couple standalone functions here. Below are a few sample commands to give you a vibe for the options.
# Simple output from text query
Invoke-LLMRequest -SimpleOutput -apikey "your_api_key" -endpoint "https://[yourapiname].openai.azure.com/openai/deployments/[yourapiname]/chat/completions?api-version=[configuredversion]" -text "What is 2+2?"
# Simple output from text query with image upload
Invoke-LLMRequest -SimpleOutput -apikey "your_api_key" -endpoint "https://[yourapiname].openai.azure.com/openai/deployments/[yourapiname]/chat/completions?api-version=[configuredversion]" -text "What is this an image of?" -ImagePath "c:\temp\apple.png"
# Full output with all response meta data
Invoke-LLMRequest -apikey "your_api_key" -endpoint "https://[yourapiname].openai.azure.com/openai/deployments/[yourapiname]/chat/completions?api-version=[configuredversion]" -text "What is 2+2?"
# Name from Command Line
Invoke-FingerprintShare -verbose -ShareName "sccm" -FileList "variables.dat" -APIKEY "your_api_key" -Endpoint "https://[yourapiname].openai.azure.com/openai/deployments/[yourapiname]/chat/completions?api-version=[configuredversion]"
# CSV Import
Invoke-FingerprintShare -MakeLog -verbose -OutputFile 'c:\temp\testouput.csv' -FilePath "c:\temp\testinput.csv" -APIKEY "your_api_key" -Endpoint "https://[yourapiname].openai.azure.com/openai/deployments/[yourapiname]/chat/completions?api-version=[configuredversion]"
# Data Table Import
Invoke-FingerprintShare -verbose -DataTable $exampleTable -APIKEY "your_api_key" -Endpoint "https://[yourapiname].openai.azure.com/openai/deployments/[yourapiname]/chat/completions?api-version=[configuredversion]"
# Name from Command Line, CSV Import, and Data Table Import
Invoke-FingerprintShare -Verbose -OutputFile 'c:\temp\testouput.csv' -FilePath "c:\temp\testinput.csv" -ShareName "sccm" -FileList "variables.dat" -DataTable $exampleTable -APIKEY "your_api_key" -Endpoint "https://[yourapiname].openai.azure.com/openai/deployments/[yourapiname]/chat/completions?api-version=[configuredversion]"
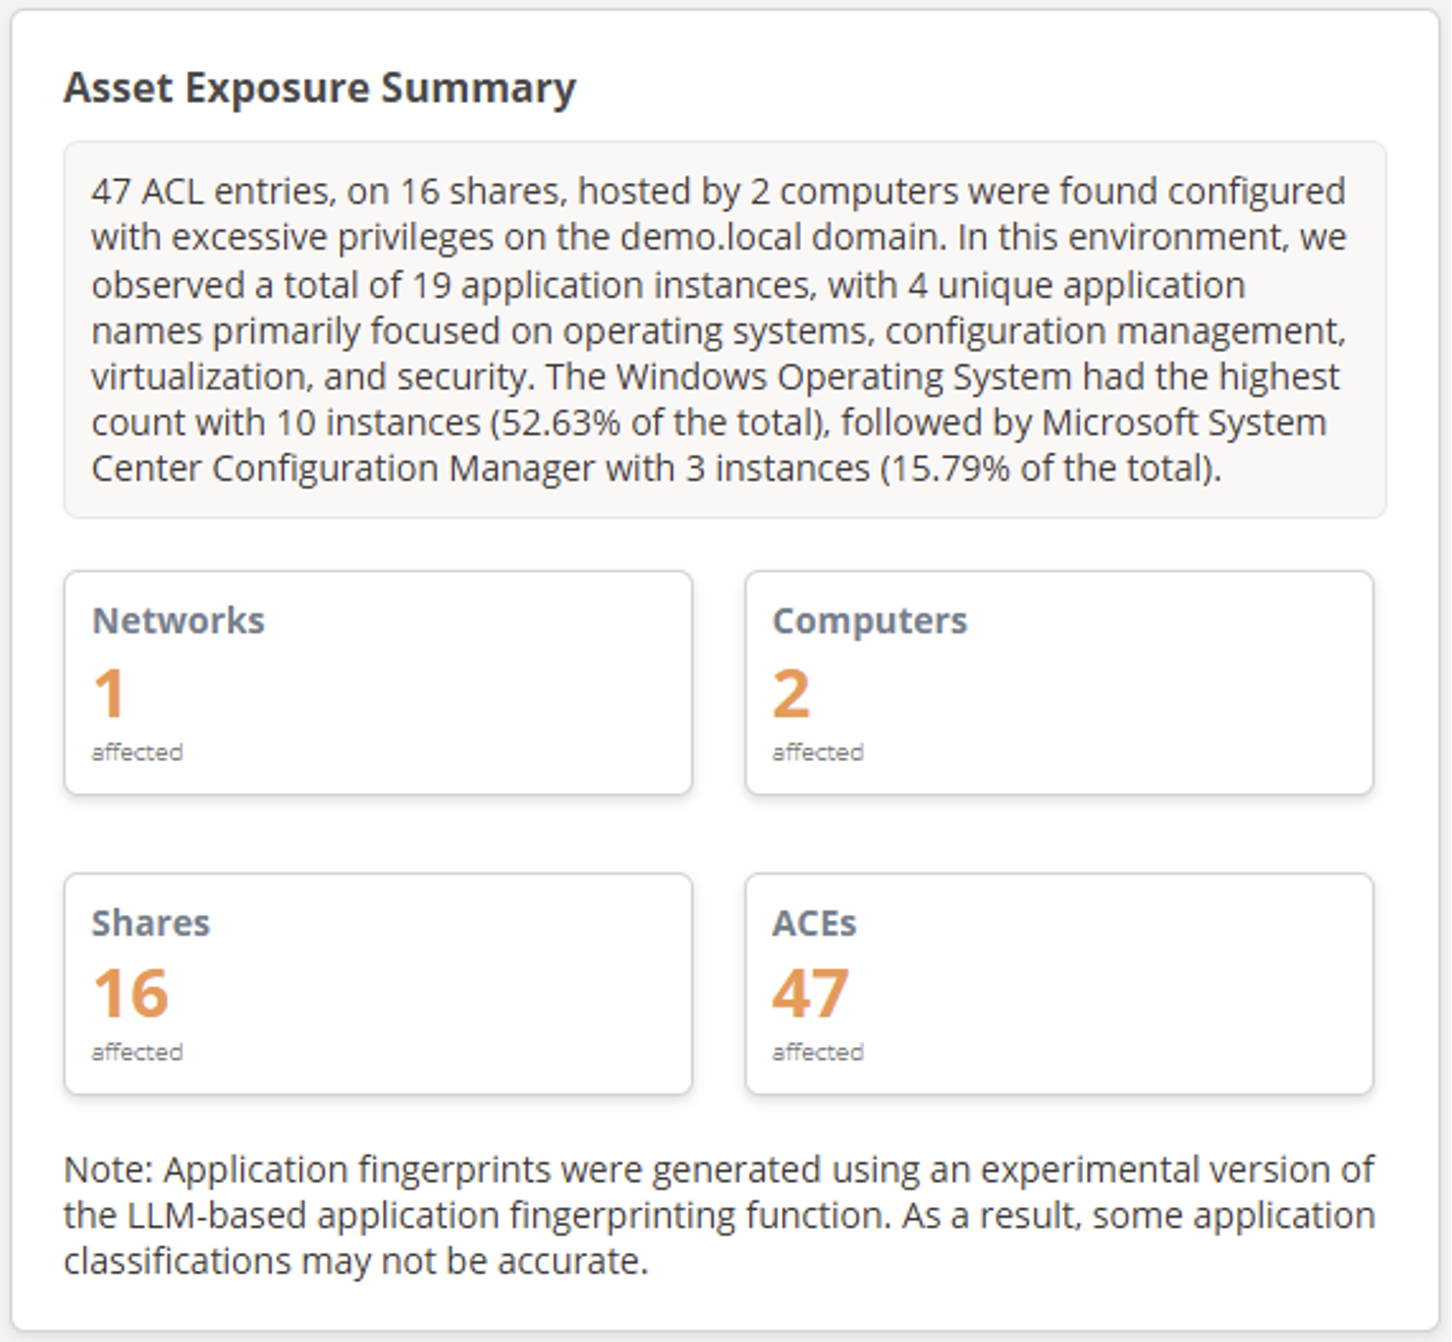
If you do end up using PowerHuntShares with the LLM option, it will generate additional csv files that include your results, and you can browse summary data in the interactive HTML report. The dashboard also includes an asset exposure summary. All the application related data is generated from the LLM requests. If you do not opt-in to use the LLM capabilities, this section simply won’t include the application related information.
If LLM capabilities are used, you’ll also be able to see the static and LLM application guess when expanding Share names on the “Share Names” page.
Finally, the guessed applications will be included in the folder group page to help provide additional context. As shown below, if the shares/files can’t be associated with an application, the “related app” section will be left blank or “unknown”.
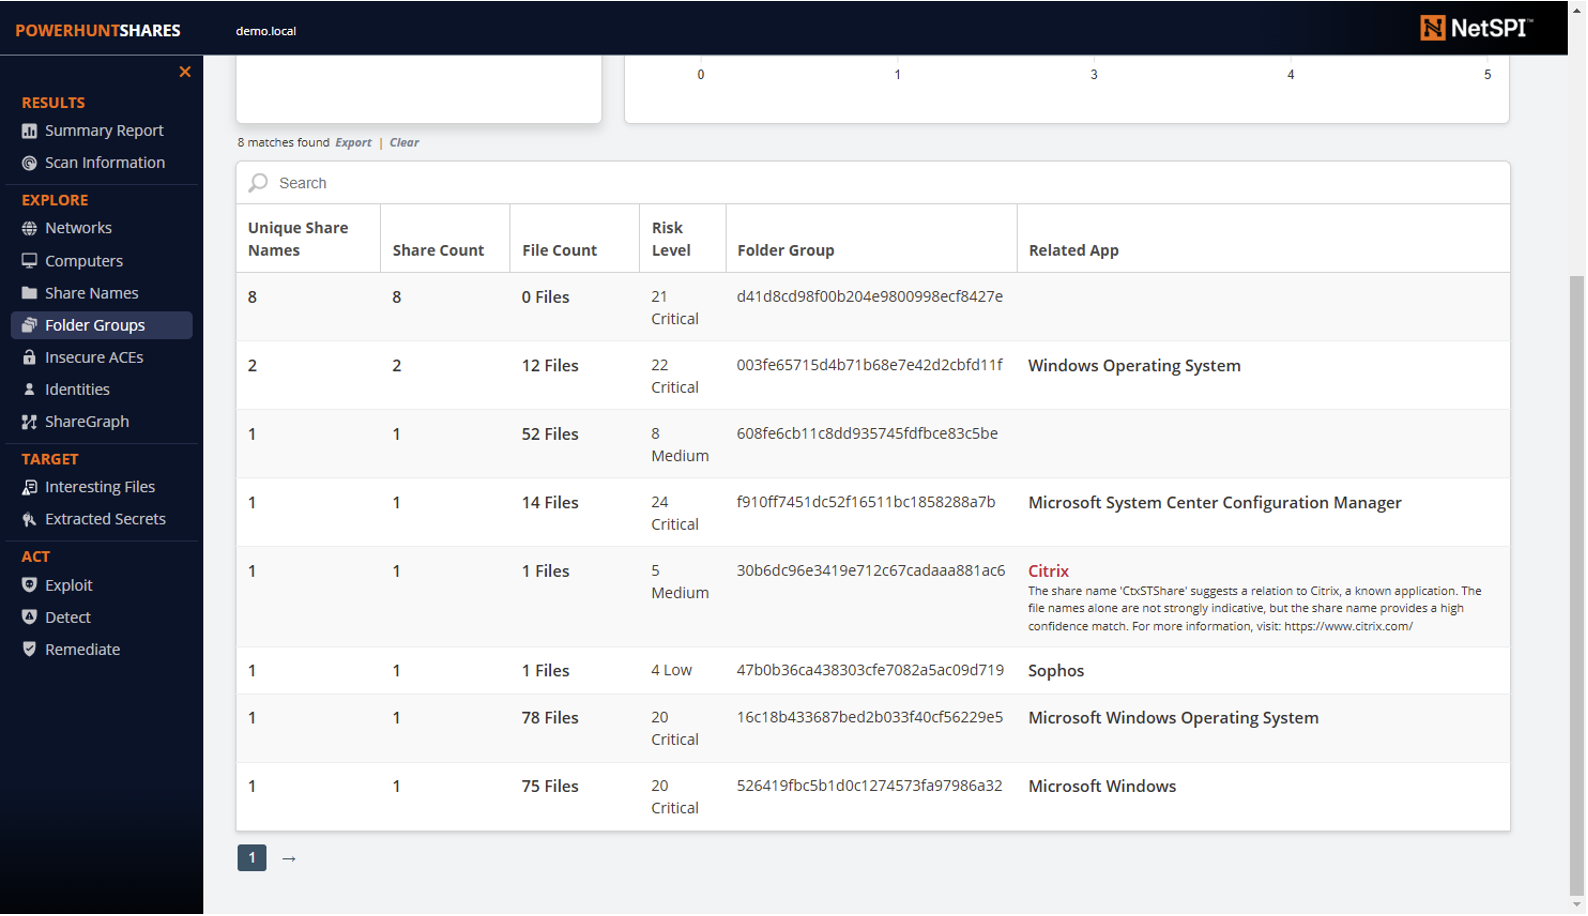
There is a lot more work to do in this space related to performance, accuracy, and benchmarking, but that will have to be something I revisit in future blogs and releases.
Share Graph
“Can you help me visualize some of these share relationships?”
I’ve only heard that a few times from clients, but I wanted an excuse to play with graph visualization, so here we are. This round I used cytoscape.js to help convert share data into nodes and edges that we can explore in the HTML report. This is still very experimental, but it does support the basic feature below:
- Search
- Keyword match
- Shortest Path
- Blast Radius
- Save Image
- Filter
- Filter out object types
- Layout
- Hide/Show labels
- Change layout using preset algorithms
- Zoom in/out
- Reset
- Show all nodes
- Canvas (right-click nodes)
- Center
- Select
- Expand
- View
- Hide
- Show
I’ll wait to get feedback from folks before spending too much more time fixing bugs or building out new features. Below is a quick sample screenshot.

As I mentioned before, Cytoscape.js also supports a variety of super fun algorithms that can be used for a number of use cases, so hopefully I will get some time to explore their utility in the next release.
Interesting File Discovery
“Excessive privileges are bad, but what data is actually exposed?”
That is a common question from attackers and defenders alike. There are a lot of tools out there that can help with this, but a few people asked if I could roll some of that basic functionality into PowerHuntShares. I did a little research and came up with about 200 file types/keywords and mapped them to 7 file categories related to data exposure and remote code execution opportunities. Hopefully the functionality will help people better understand where there may be risk of password exposure, data exposure, or command execution. Those categories include:
- Sensitive
- Secret
- SystemImage
- Database
- Backup
- Script
- Binaries
I realize that people may have their own categories and lists of target files/extensions, so I also added a feature to allow you to import those at runtime. You can download the template file here, and then use it to search for things you care about using the command below.
Invoke-HuntSMBShares -OutputDirectory 'c:\temp' -DomainController 'dc1.domain.com' -Username 'domain.com\user' -Password 'YourPassword' -FileKeywordsPath "C:\temp\interesting-files-template.csv"
Either way, PowerHuntShares will save your output to the csv and show your categories in the interactive HTML report. Below is a sample screenshot of the summary chart found on the dashboard page.

There is also a dedicated Interesting Files page that allows you to search, filter, dig into, and export UNC paths for files you may care about.
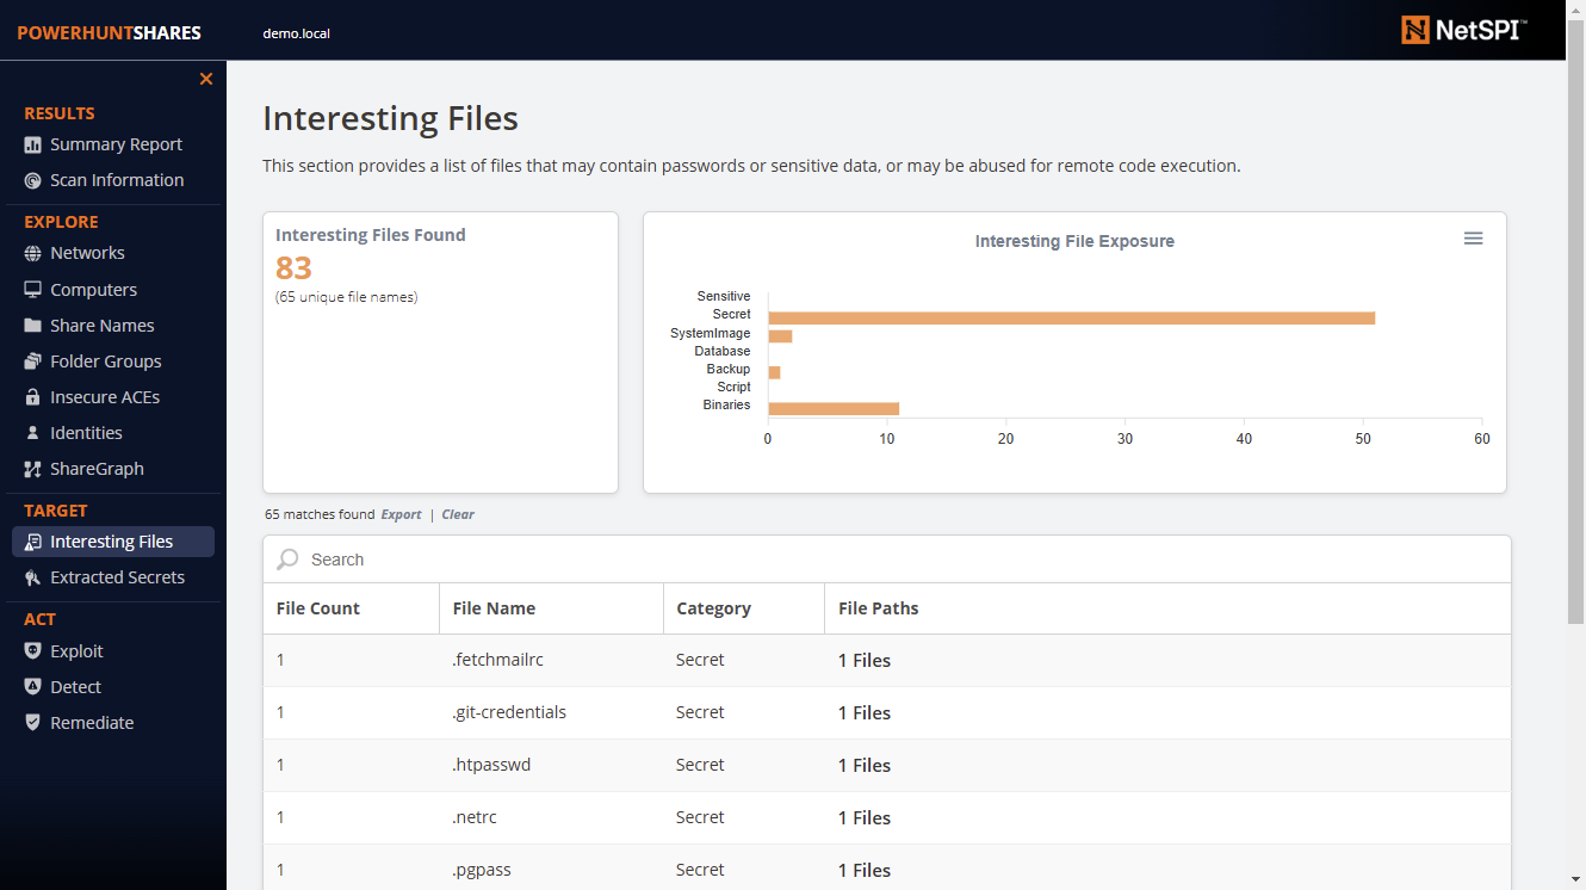
Secrets Extraction from Configuration Files
“Cool, I like the interesting files thing, but could you parse the passwords for me?”
I’ve heard this a lot from the pentest test team. I also researched common configuration files and wrote 50 configuration file parsers that can extract credentials of various types. They are all run automatically. For example, if the scanner finds a web.config file, it will extract the username, password, and other relevant bits from the file, save them to csv, and include them in the interactive HTML report shown below.

Just like the other tables, you can search, filter, sort, and export the list of target files. Also, as a bonus I have released the individual configuration parsers as standalone PowerShell scripts along with sample configuration files.
Considering I wrote 50 new parsers, my guess is that there will be edge cases that I haven’t considered. So, if you find a bug, please submit an issue or pull request to the GitHub project. If you’re not code savvy, also feel free to reach out to me on Twitter/X.
While you’re surfing GitHub for more open-source projects in this space, I also recommend checking out SMBeagle, Snaffler , Nemesis, and of course the original Find-InterestingFile function from PowerSploit.
Mini Video Walkthrough
Below is a quick video walk through of the new updates in the PowerHuntShares v2 release.
Wrapping Up
This is still the beginning of exploring how we can better identify, understand, attack, and remediate SMB shares in Active Directory environments at scale. There are many features and fixes I would like to apply to PowerHuntShares as time goes on, but for the meantime, I hope this release helps open some new doors for people.
Explore More Blog Posts

3 Key Takeaways from Continuous Threat Exposure Management (CTEM) For Dummies, NetSPI Special Edition
Discover continuous threat exposure management (CTEM) to learn how to bring a proactive approach to cybersecurity and prioritize the most important risks to your business.

How Often Should Organizations Conduct Penetration Tests?
Learn how often organizations should conduct penetration tests. Discover industry best practices, key factors influencing testing frequency, and why regular pentesting is essential for business security.

Mainframe State of the Platform: 2025 Security Assessment
Learn key insights into mainframe security in 2025, including trends, gaps, and strategies to enhance protection for critical enterprise systems.

